Large Scale Photogrammetry - Urban
Perhaps one of the most important and useful developments in the past decade has been the proliferation and commercialization of UAV platforms. Drone technology has become a viable and cost-effective way of carrying out aerial photogrammetry of larger areas, and as a result, generating 3D maps which can be used for urban analyses and for contextual design work.
The difference between using such data in conjunction with, or even instead of, usually older CAD plans is the qualitative and real world details that they include. Oftentimes, the initial plans differ from the actual built result when discussing large scale projects, with the incidental and unplanned details which characterize these built environments having the potential to affect suggested design ideas.
We have carried out a number of large scale photogrammetry scans, both of urban environments and of terrain, for analytical and design purposes. In this segment, we are including two examples carried out in Nicosia. The first was for urban block analysis and the second was as part of a site analysis for a design project.
Example 1 - Urban Blocks in Latsia, Nicosia
This project required an analysis of urban blocks in terms of the architectural typologies and the general road distribution and accessibility that characterizes them. A residential block in the area of Latsia, off one of the main roads was selected and a series of flights with a DJI Phantom 3 drone were carried out.

ISOMETRIC VIEW OF URBAN BLOCK ANALYSIS - Color Coded
The photographs were taken in a series of circular flights with various points of interest, focusing primarily on the four, color coded clusters of buildings seen above. It took approximately 6 separate flights, with the images taken at 45° (so an oblique photogrammetry method) so as to ensure that vertical distortion was kept at a minimum.
As the scale was determined to be 1:500 and above, the aerial images were considered detailed enough for the purposes of this study.
The first analysis carried out was the separation and color coding of the separate building clusters which would be analyzed in terms of their typology and character.
The second step was to extract section diagrams from the main model.
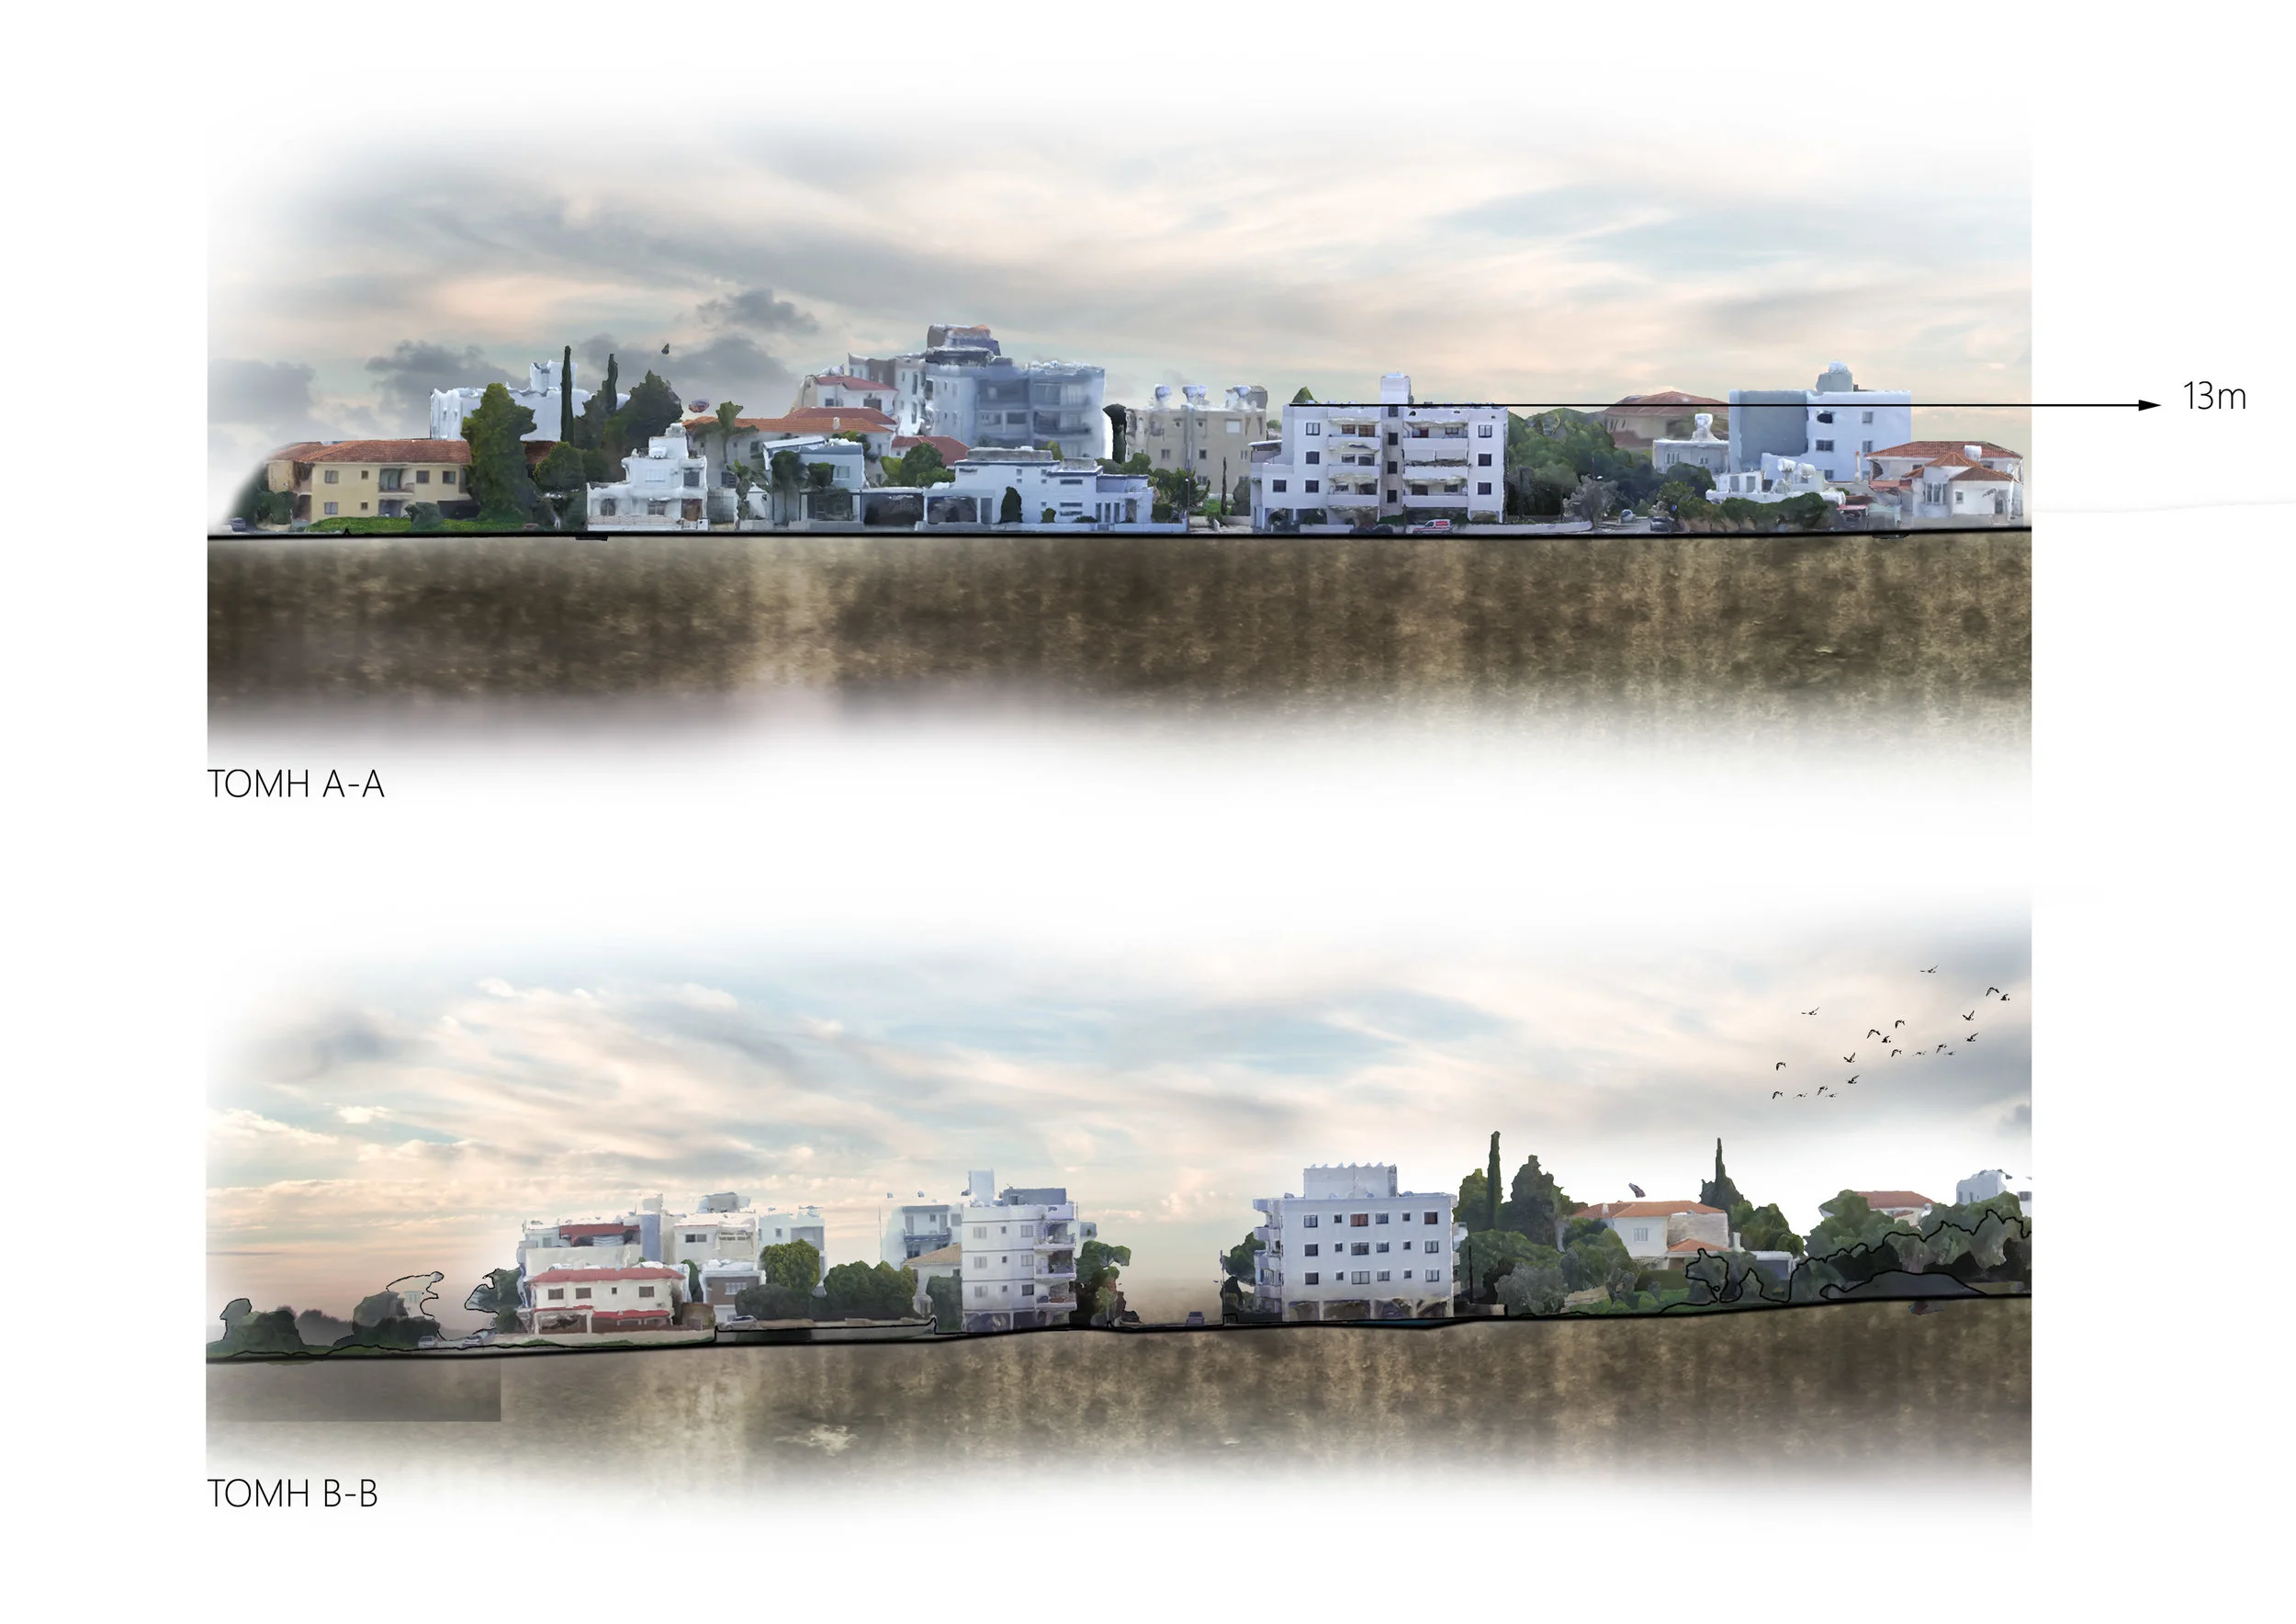
TWO SECTIONS THROUGH ANALYZED URBAN BLOCKS
Sections A-A and B-B were taken at the points shown in the first image. Section B-B shows a slight incline which is largely imperceptible when walking through the area.
The next step involved comparing the typologies of the color coded blocks and writing some general notes based on those observations.
These blocks were labelled based on their defining characteristics and some additional information was added in, such as the average plot areas as determined from the scanned model, and certain access and navigation paths which were noticed.
To summarize the basic analyses carried out, the four blocks were labelled and discussed as follows :
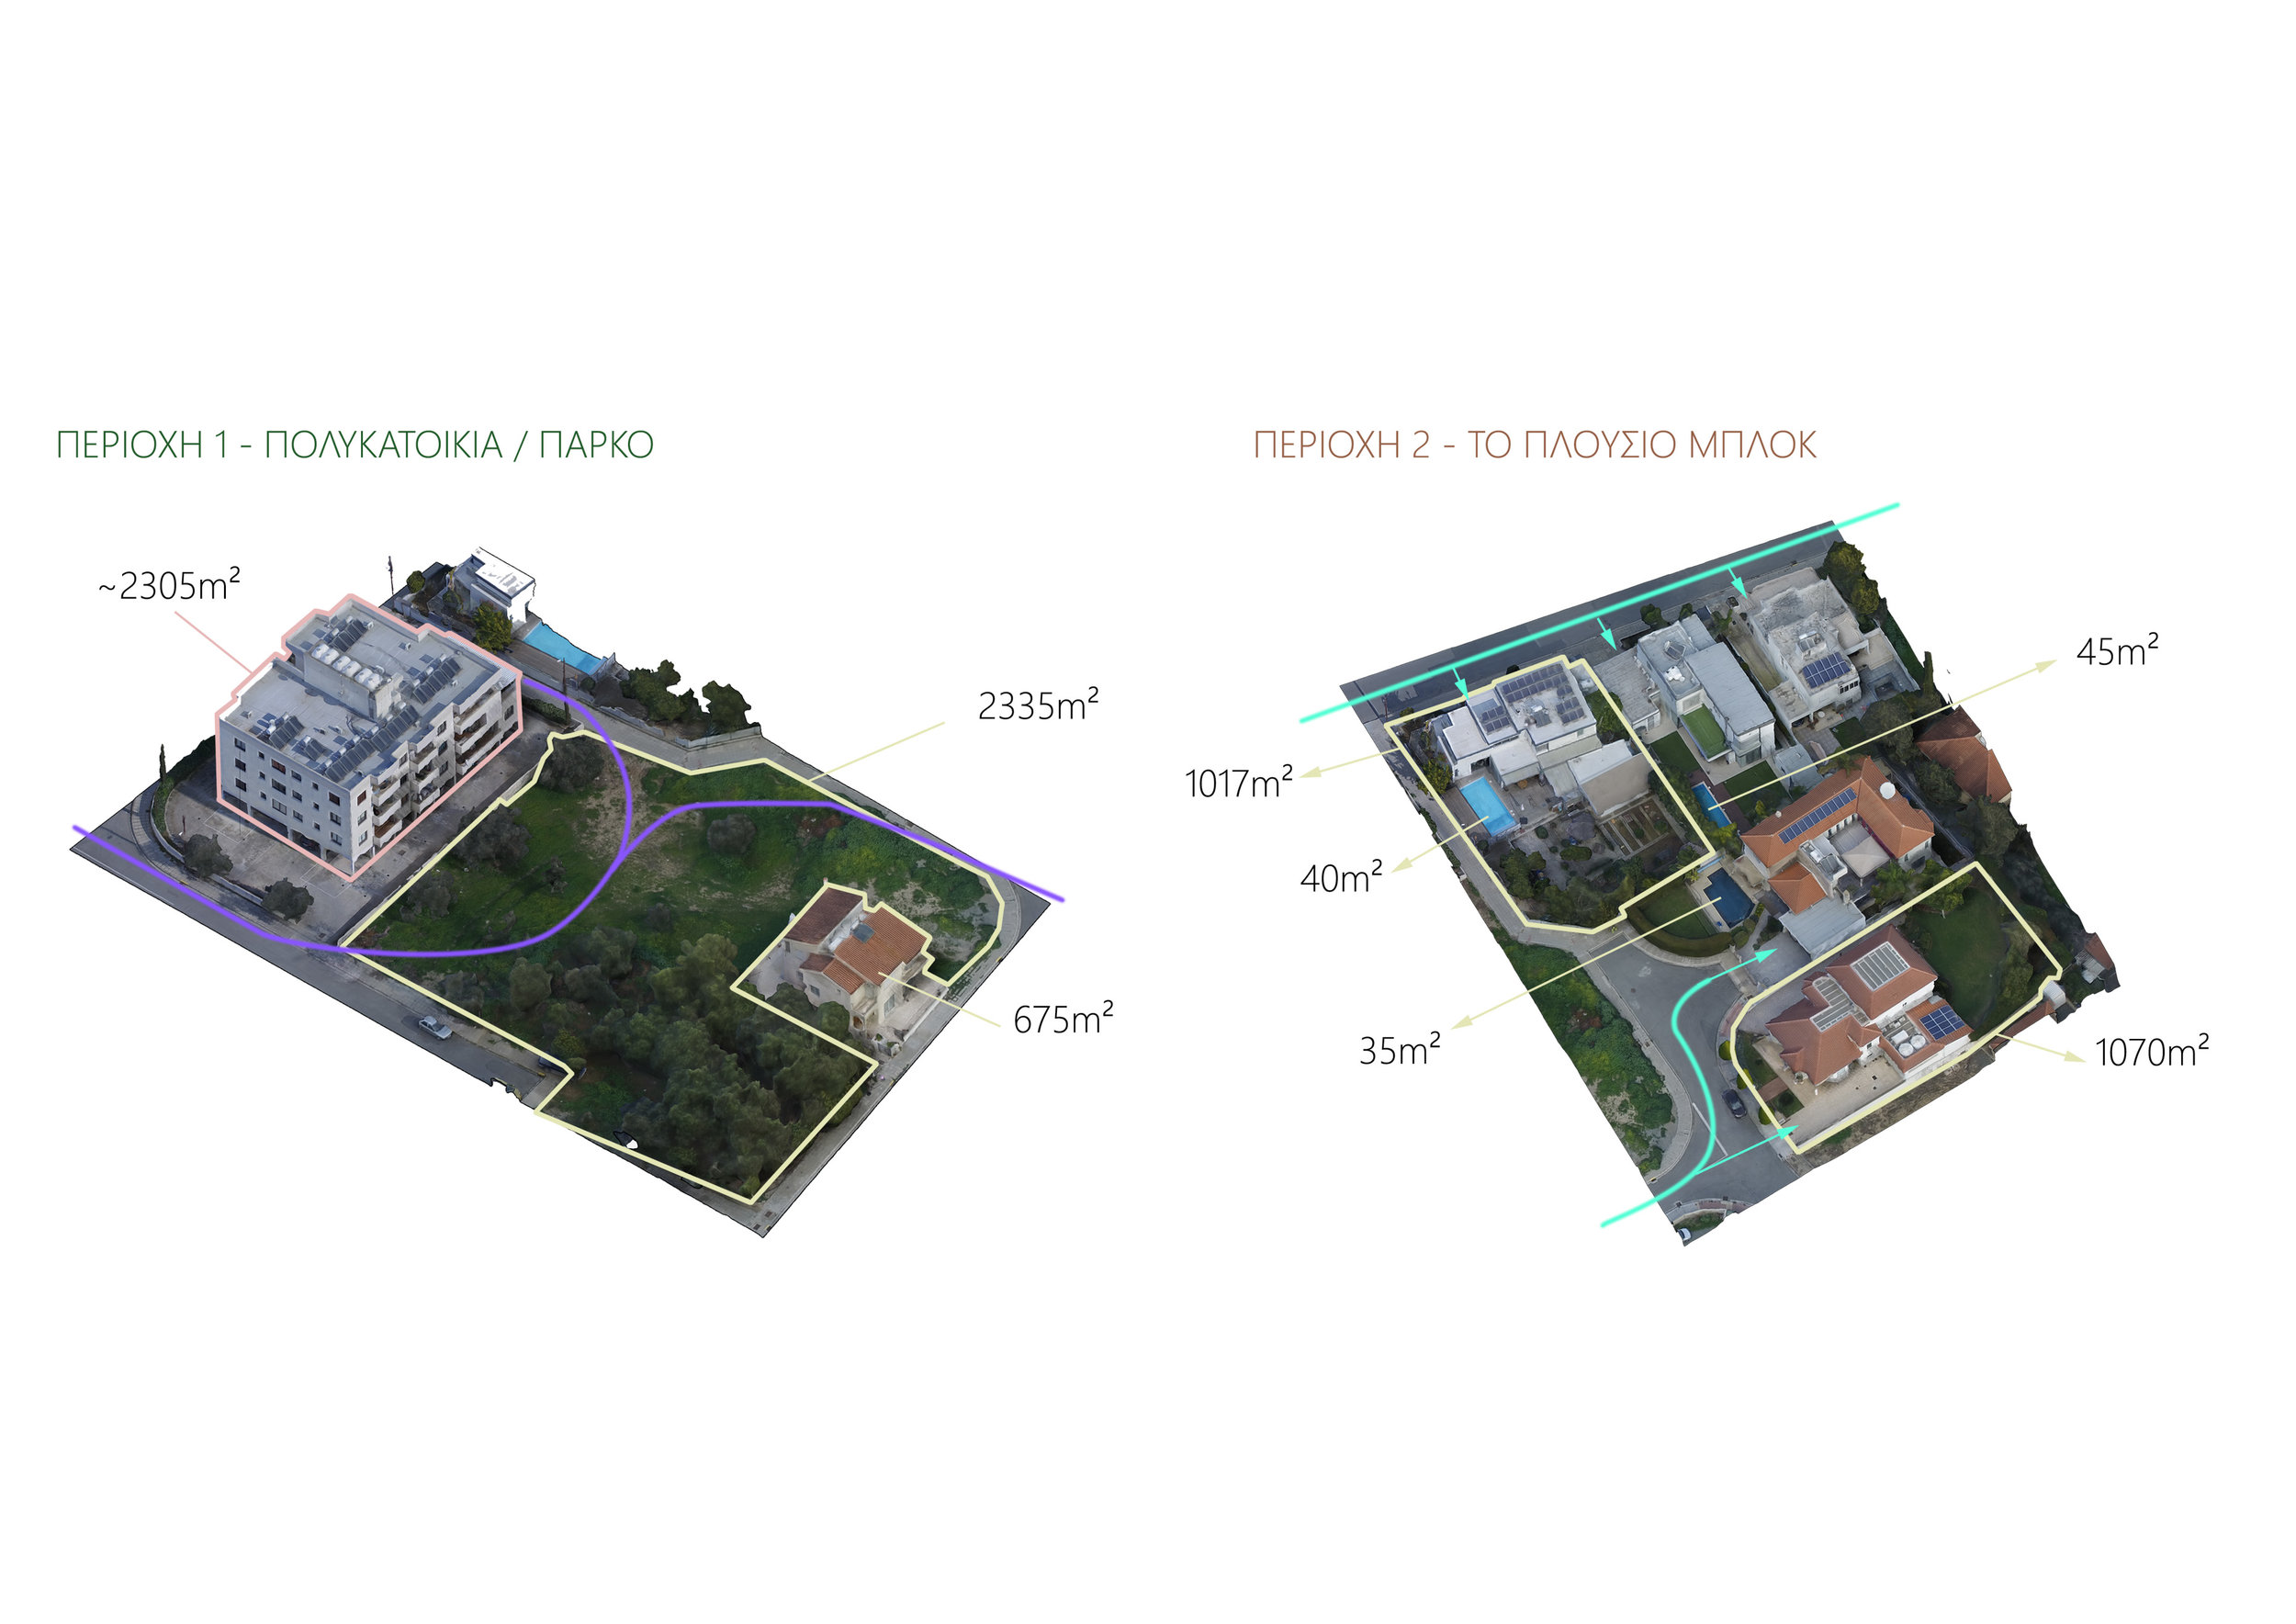
Block 1 - Condominium + Park Area - this block is characterized by a heavy condominium structure of three floors, covering approximately 2305m² through its floors. A similarly sized green area can be found immediately behind this structure and serves to illustrate the contrast between having that area split across 4 floors and having it spread across the terrain.
Block 2 - Luxury Block - this block is situated next to the abovementioned condominium and features larger plots with larger housing which feature ‘luxury’ amenities, such as swimming pools. Another interesting point is that these houses are not provided equal access to the main road, with the property covering 1070m² requiring a detour to access.
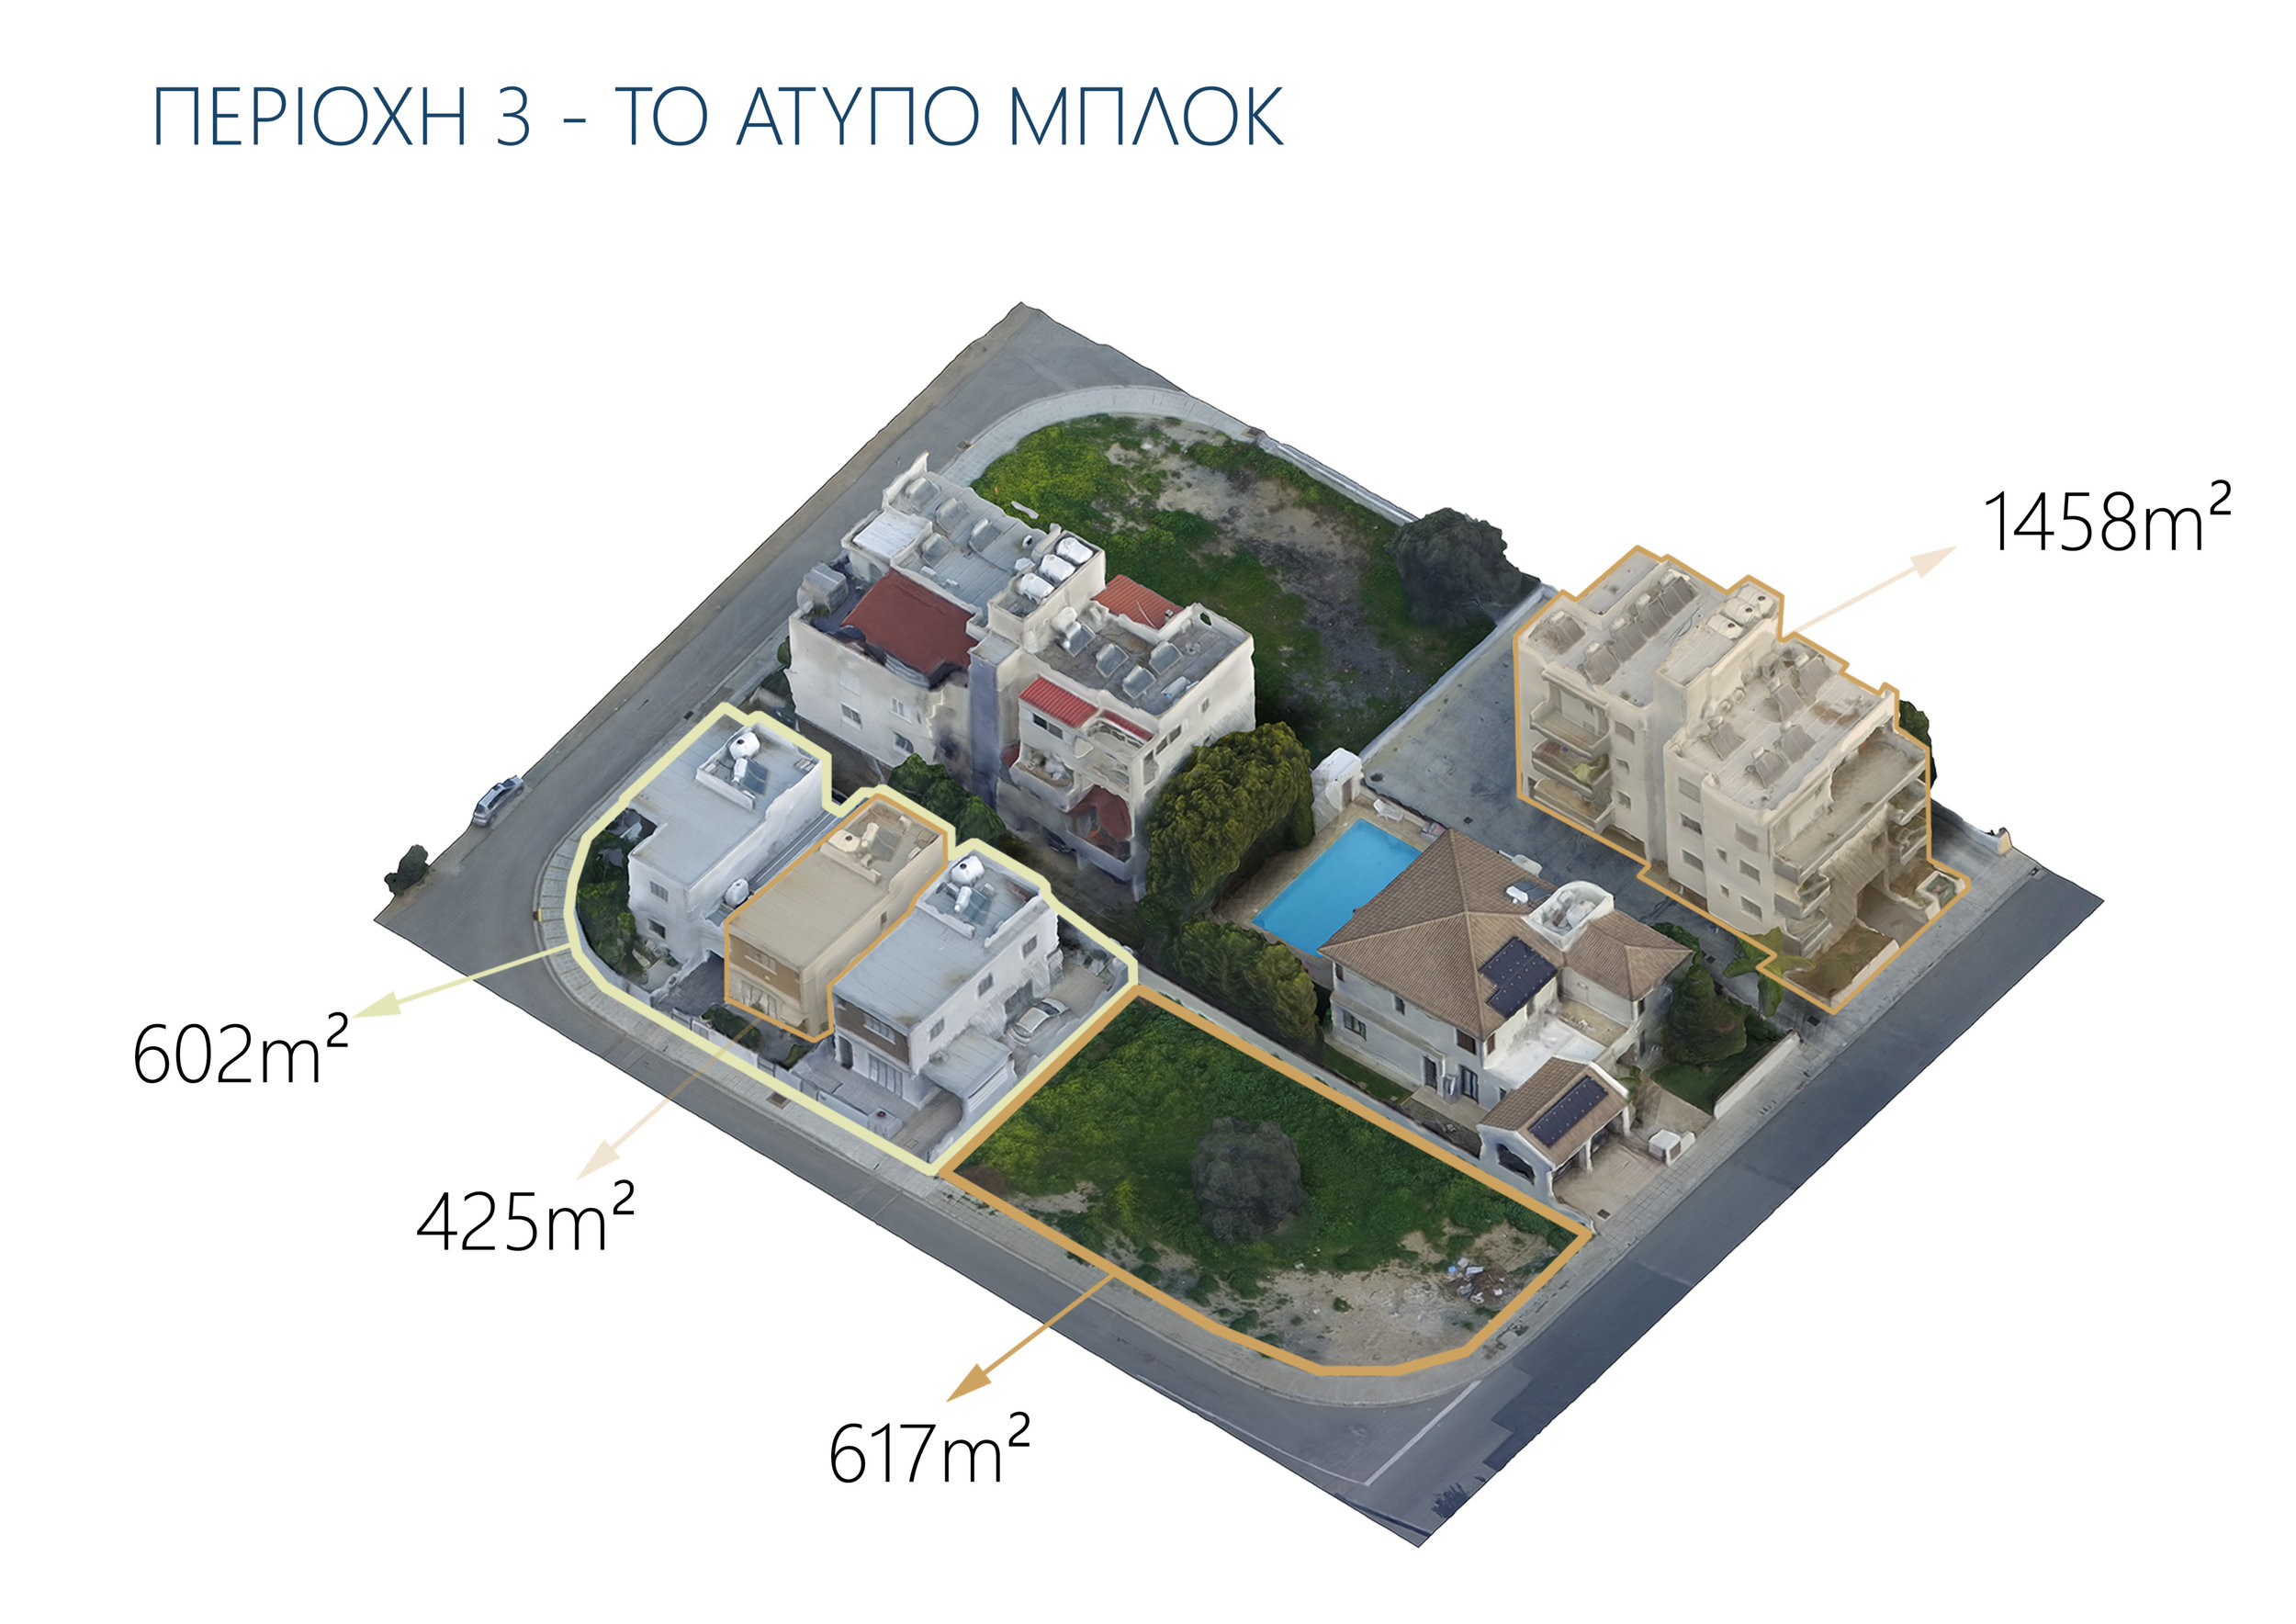
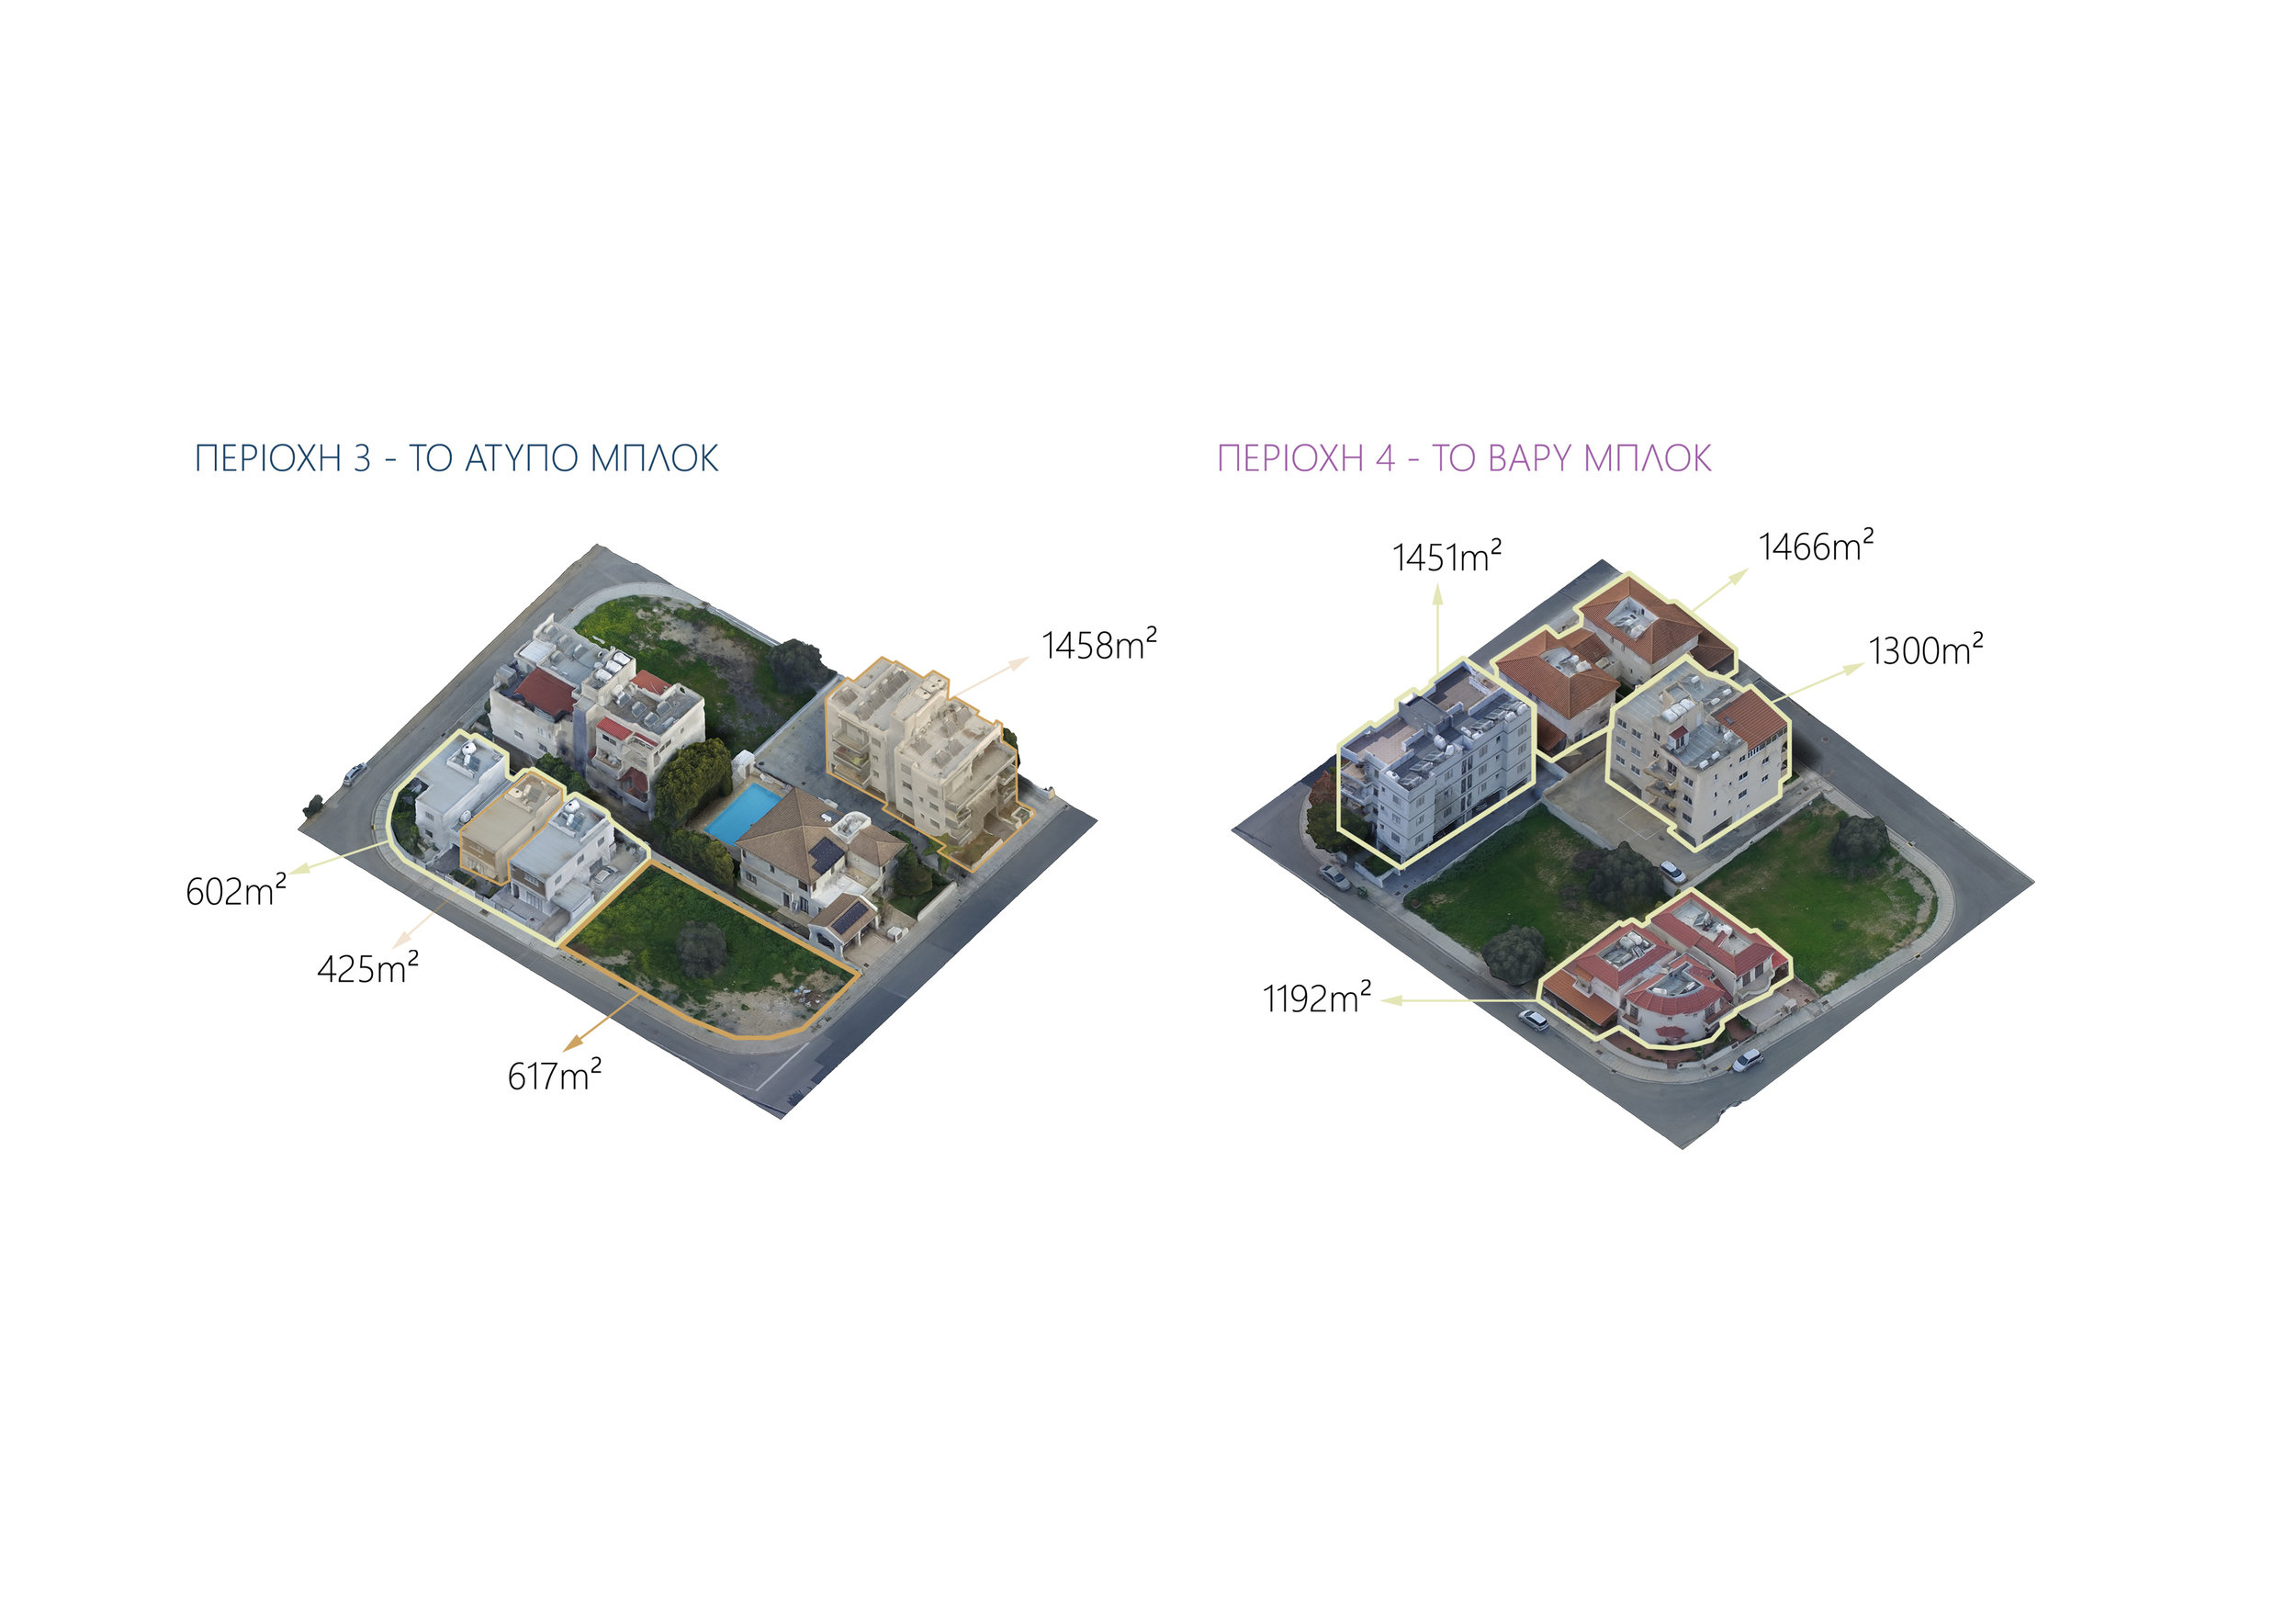
Block 3 - The Atypical Block - this block is situated on a residential island, encircled by peripheral road access and is primarily defined by the mish-mash of architectural typologies of the structures featured. There is a larger villa with swimming pool situated next to a condominium with a series of smaller modern houses placed on narrow plots immediately behind it. Another heavy condominium can be found immediately next to these.
Block 4 - The Heavy Block - this block is characterized by the density of the buildings it contains. Another encircled island consisting of heavy condominiums and blocky residential units.
Another analysis carried out was the extraction of a row of road-facing buildings from a birds-eye view so as to be able to, at a glance, notice the different architectural typologies which characterize most building blocks in the city.

From left to right there are examples of a newer architectural style, to more modernist block in the condominium, to a medley of different types around the corner cluster. This extends to the roofs of the buildings with an assortment of sloped and flat roofs evident throughout.
Conclusion
The photogrammetric model offered a number of benefits for this urban block analysis. Though the analyses presented here are fairly rudimentary and simple, limited only to typologies and areas, due to the 3D nature of the data, the scope for additional and more detailed analyses is very much present. As such, sun/shade simulations could be carried out along with facade views and analyses as these would be directly inferred from the model itself.
Perhaps the biggest benefit was the speed and relative ease with which this analysis was carried out. The photographic component was completed in a single site visit, while the generation of the 3D model and its scaling took a few hours.
Furthermore, the model itself could be used as a contextual model for additional design work, a methodology which will be discussed in the next example below.
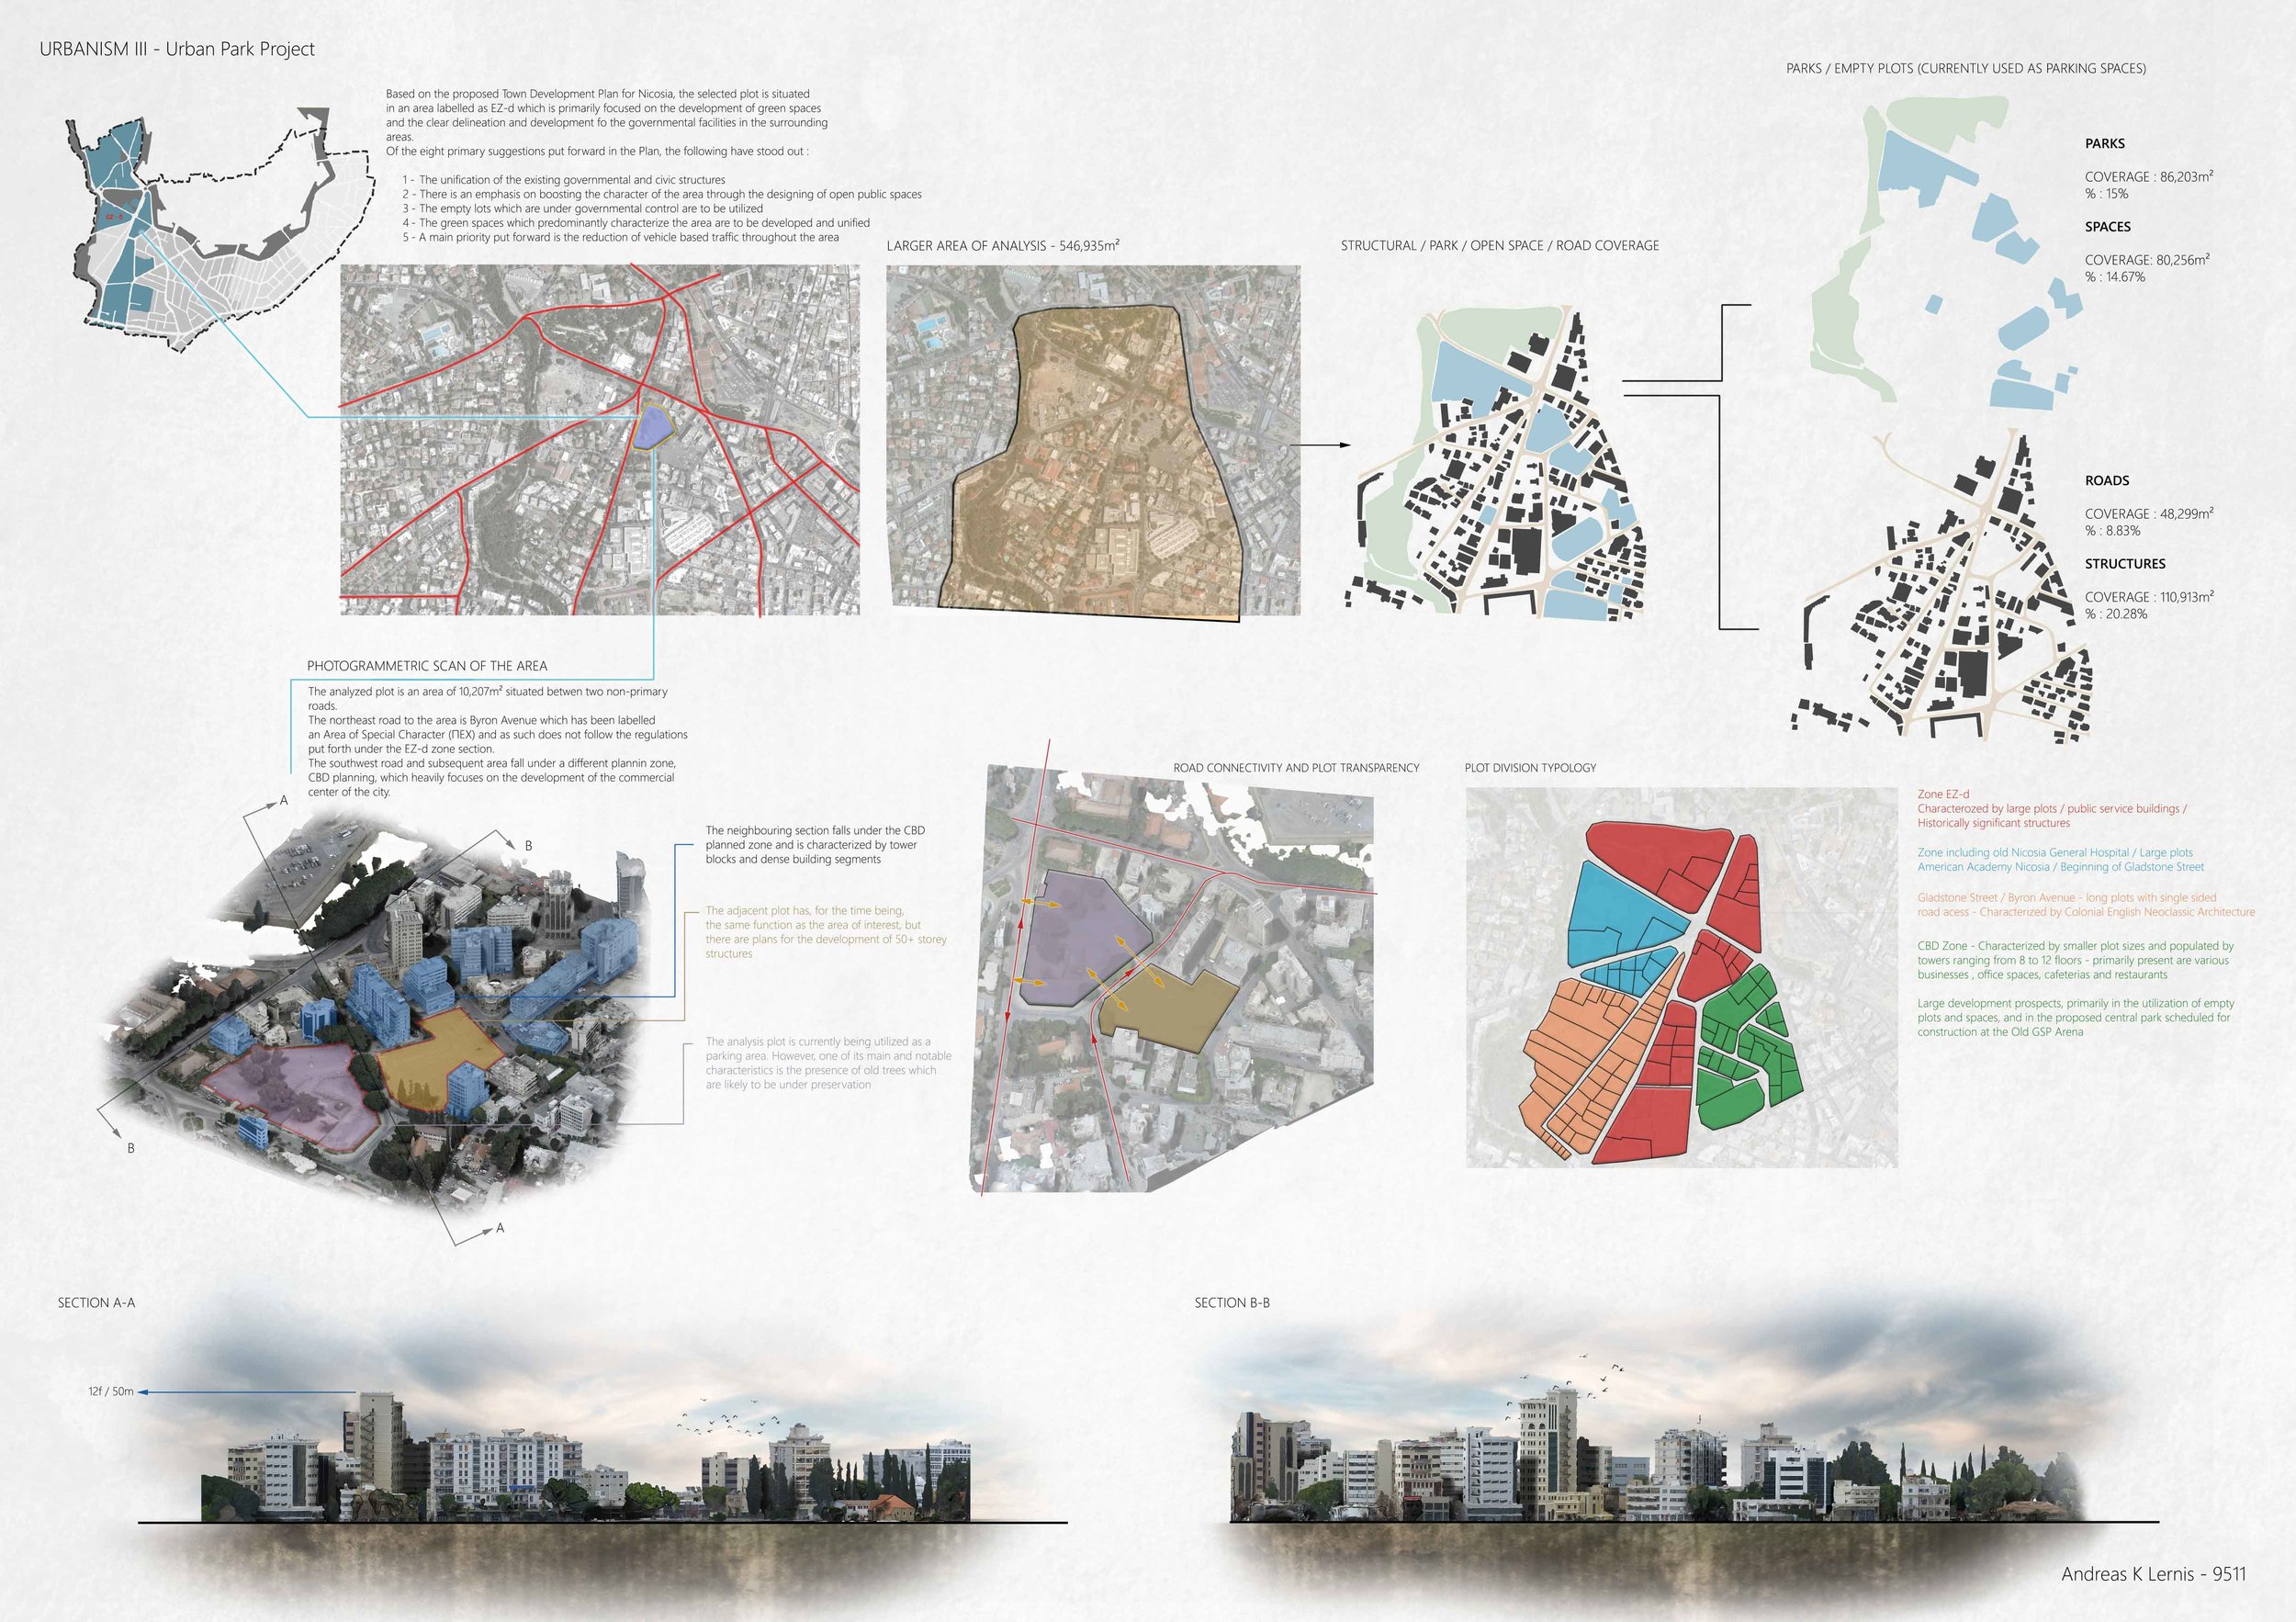
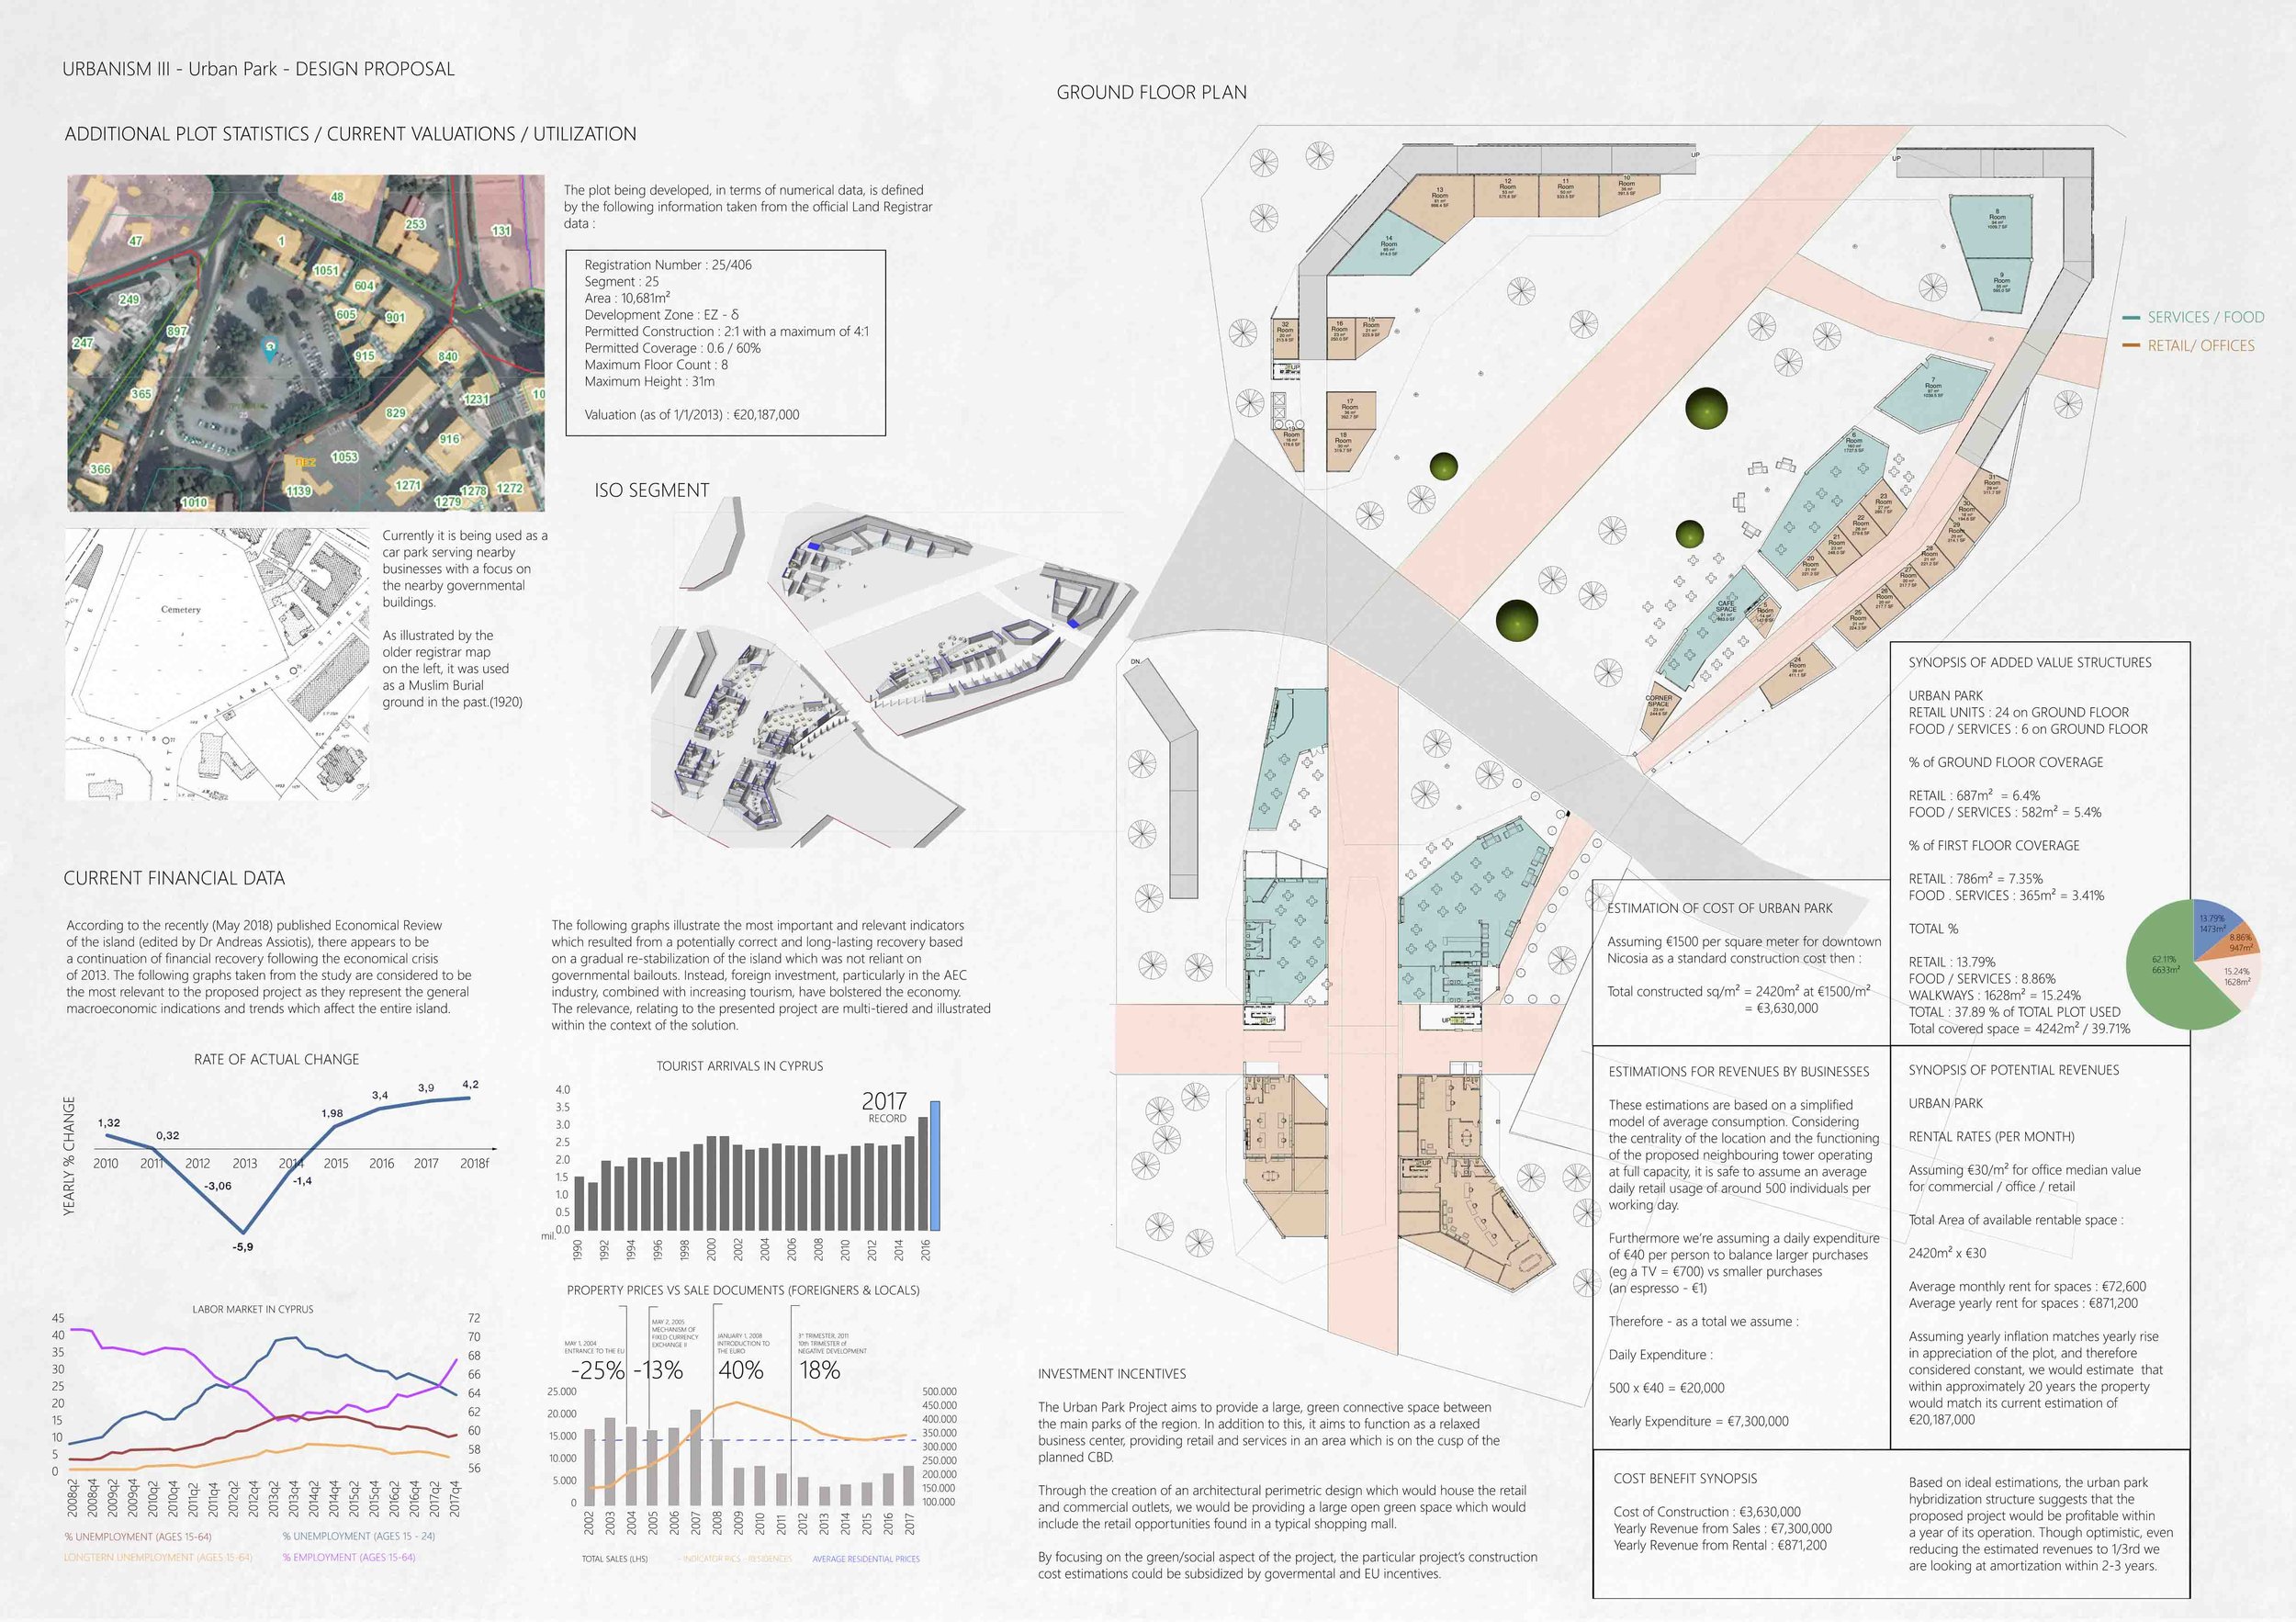
Example 2 - Downtown / Nicosia - Site analysis and design
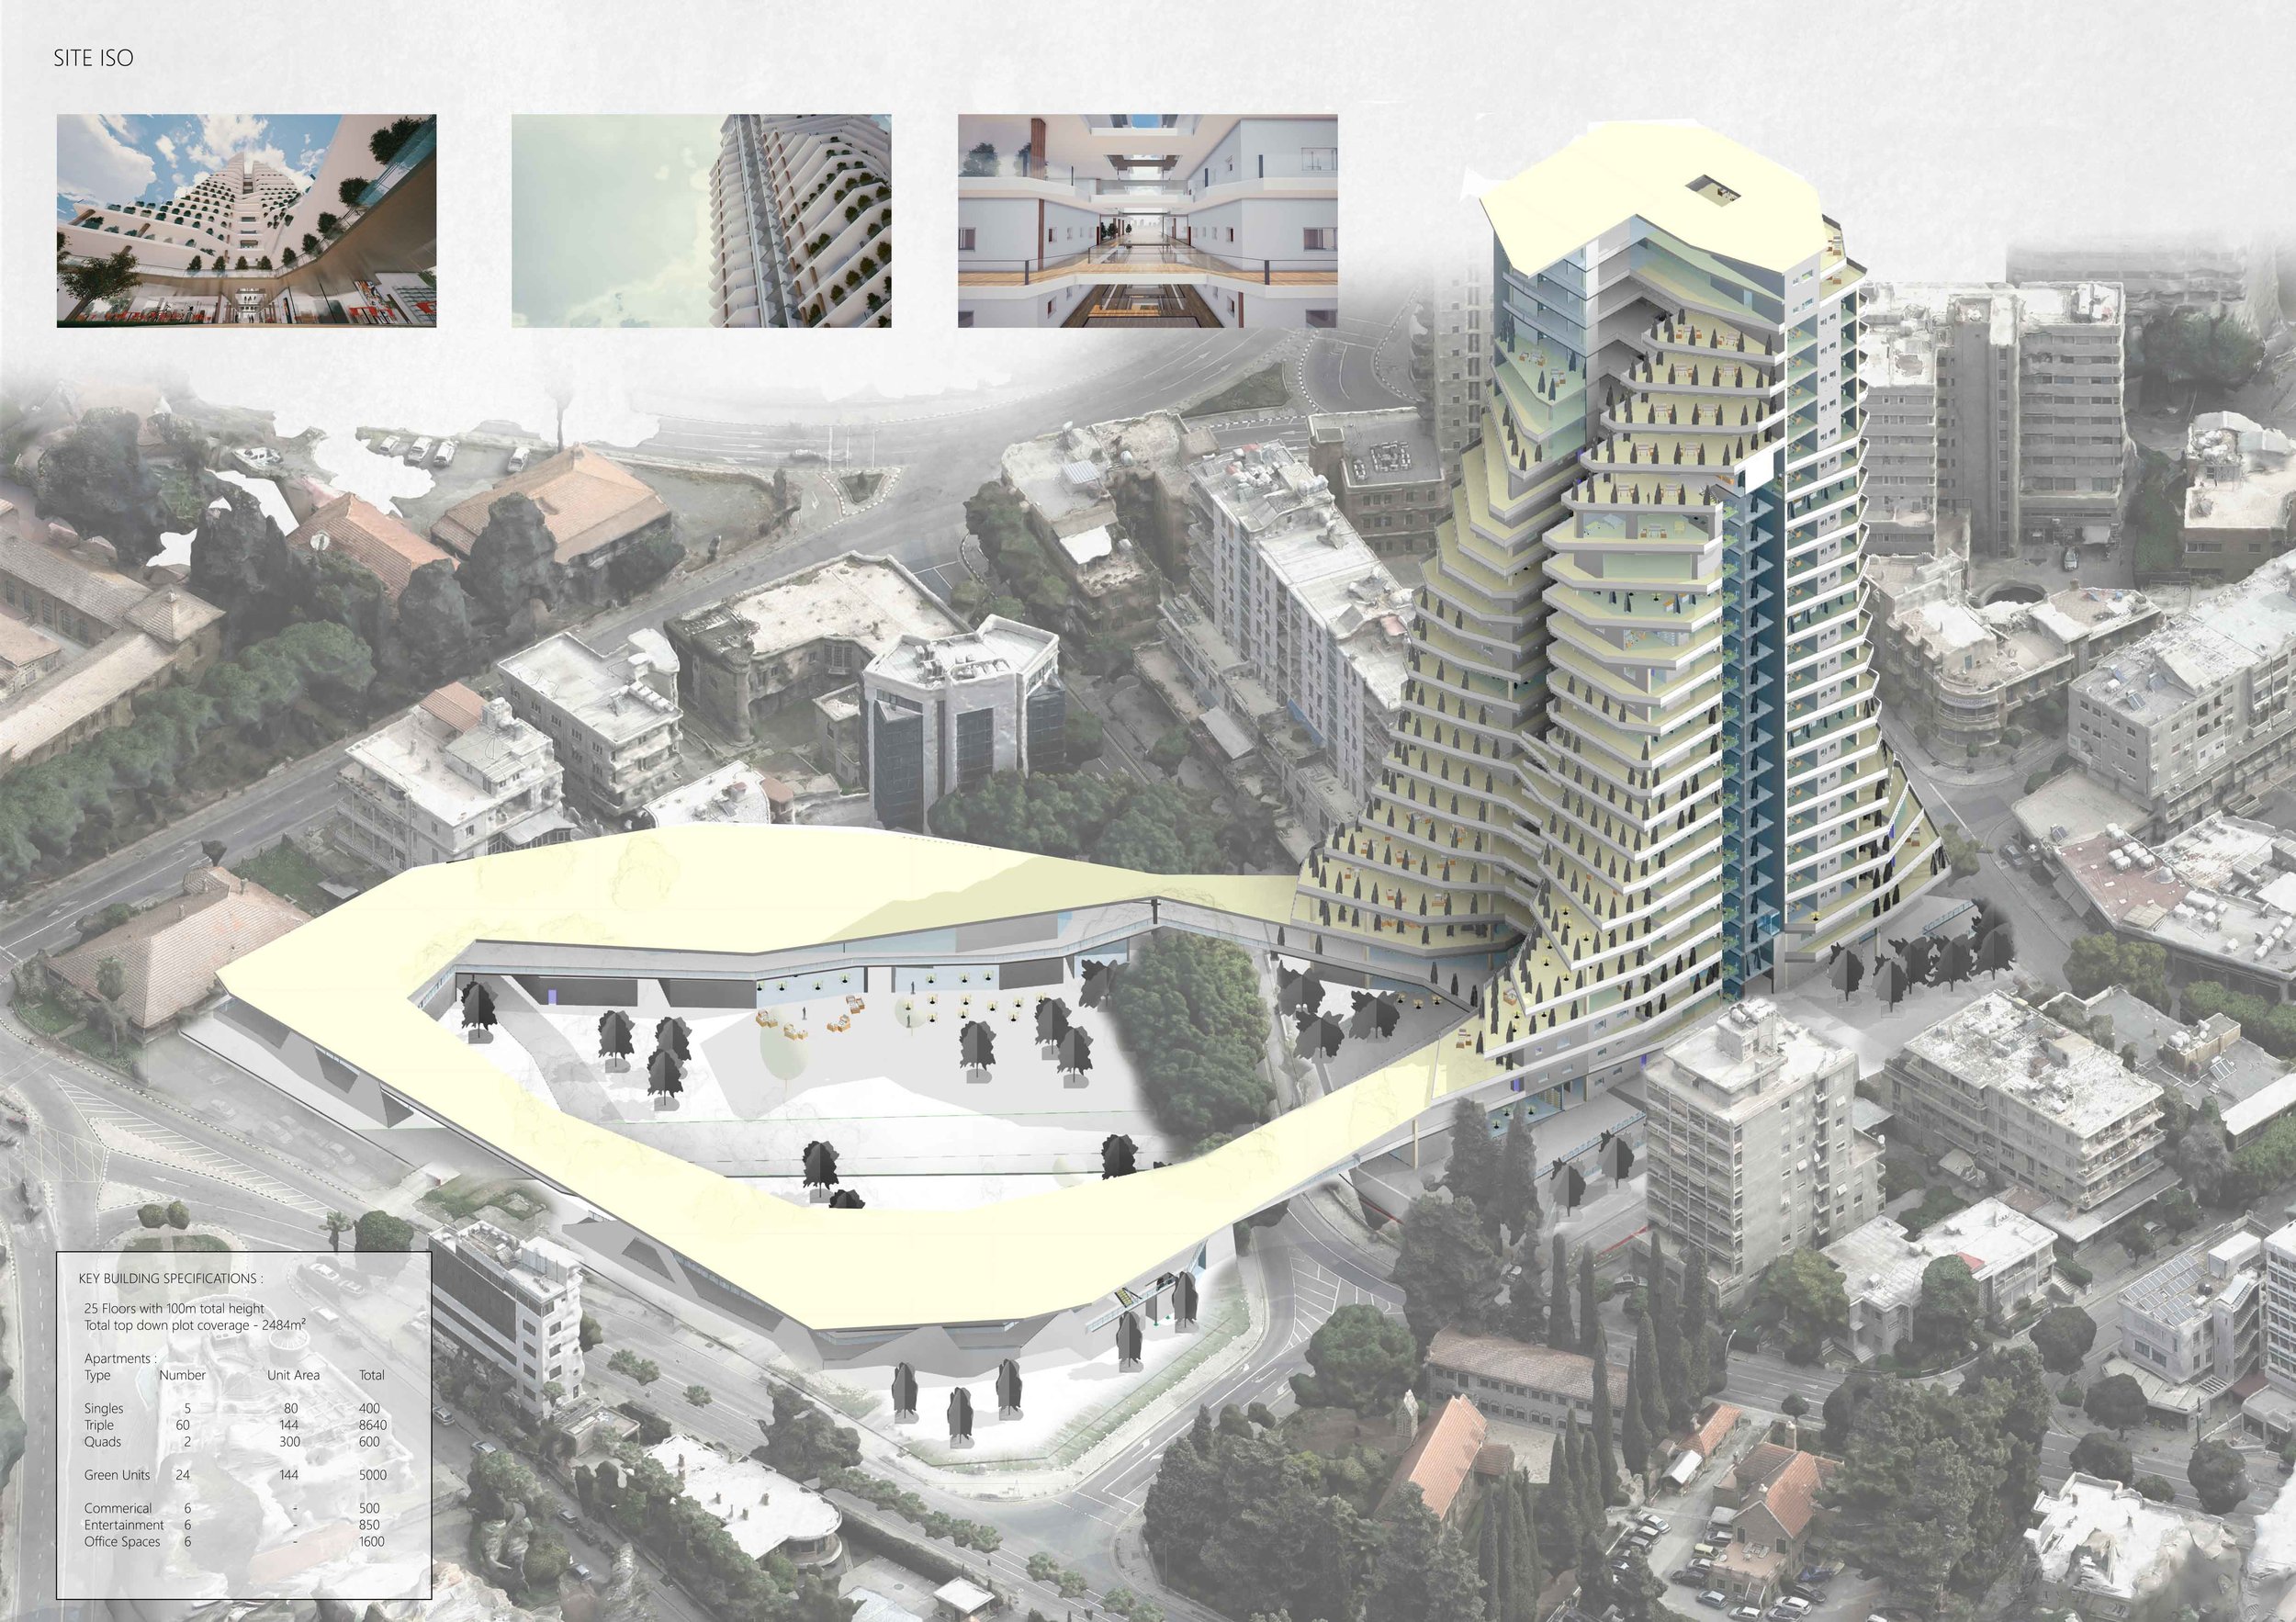
This particular project required the drafting of a combined urban and residential construct across two different building zones separated by a single road. The final project can be found here, so we will not be delving into too many details regarding the design aspect in this segment, instead focusing primarily on the methodology and benefits provided through the utilization of aerial photogrammetry to create a 3D map of the site.
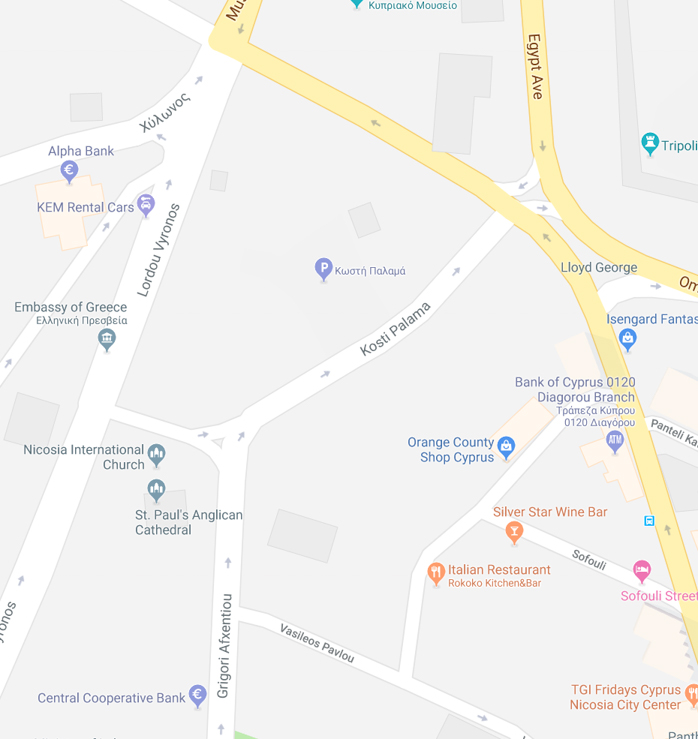
The site in question is illustrated in the images below and is situated very close to the old city walls. Specifically, it involves the two plots of land bordering Kosti Palama street.
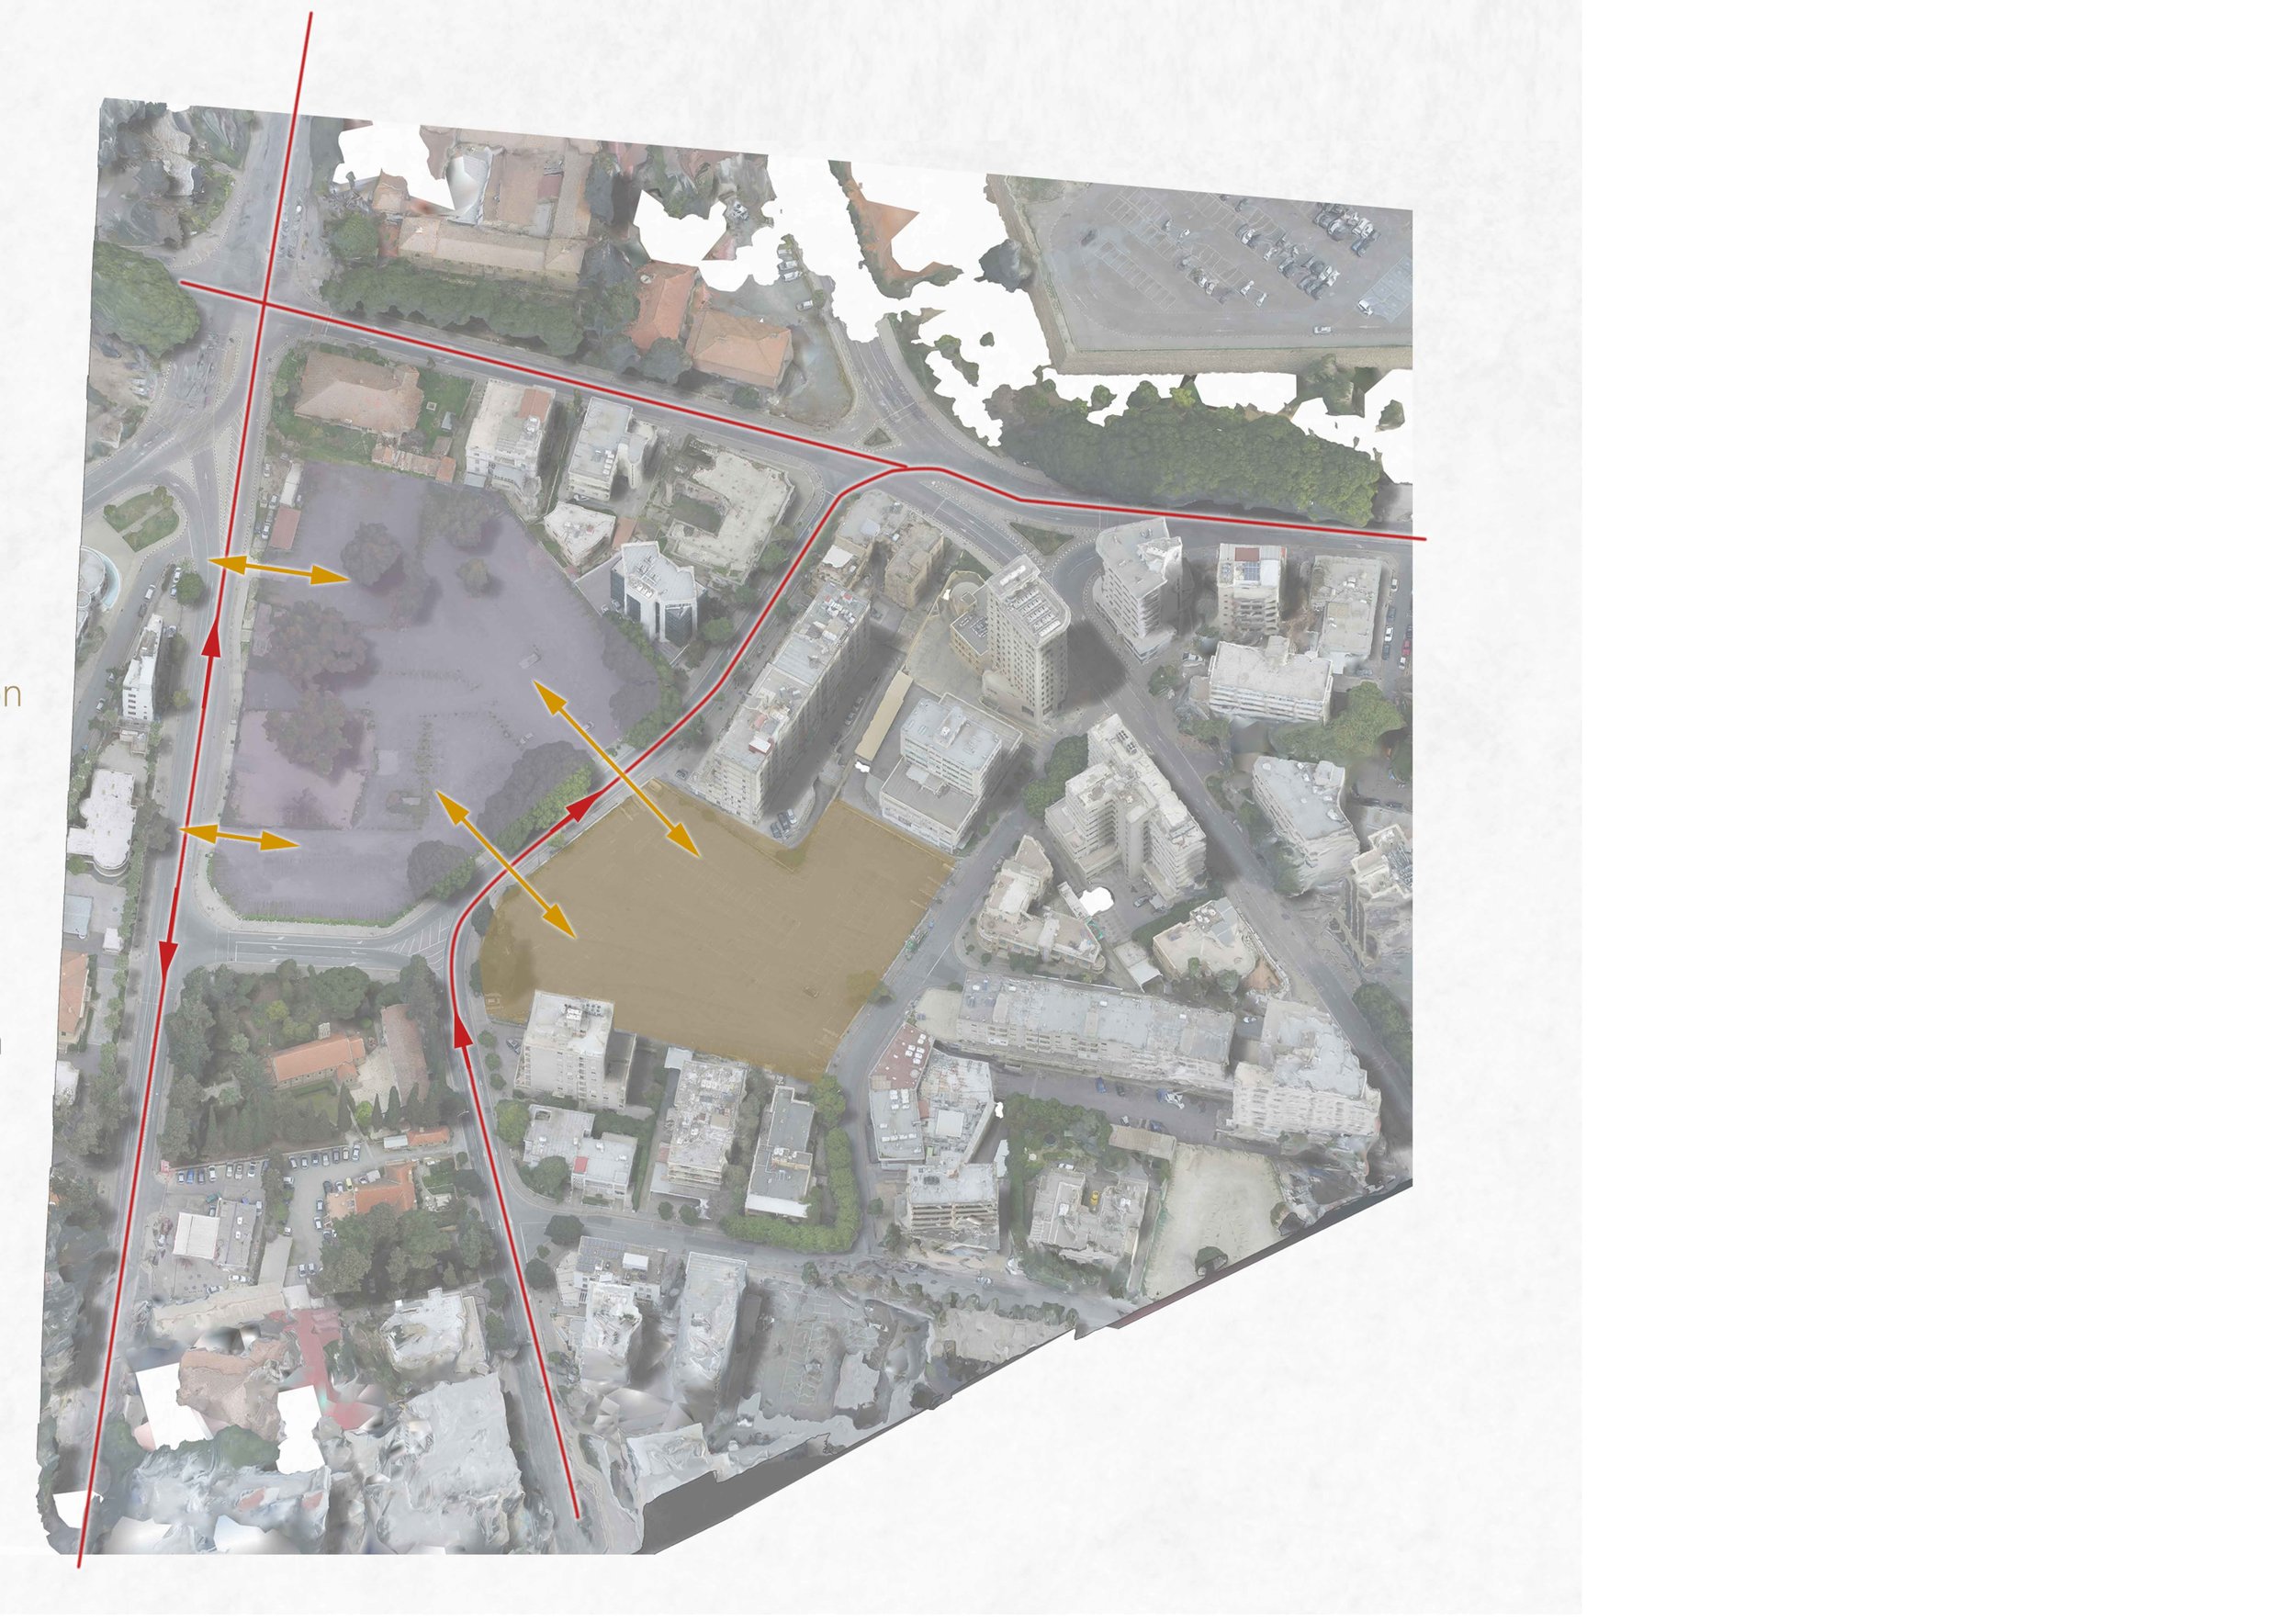
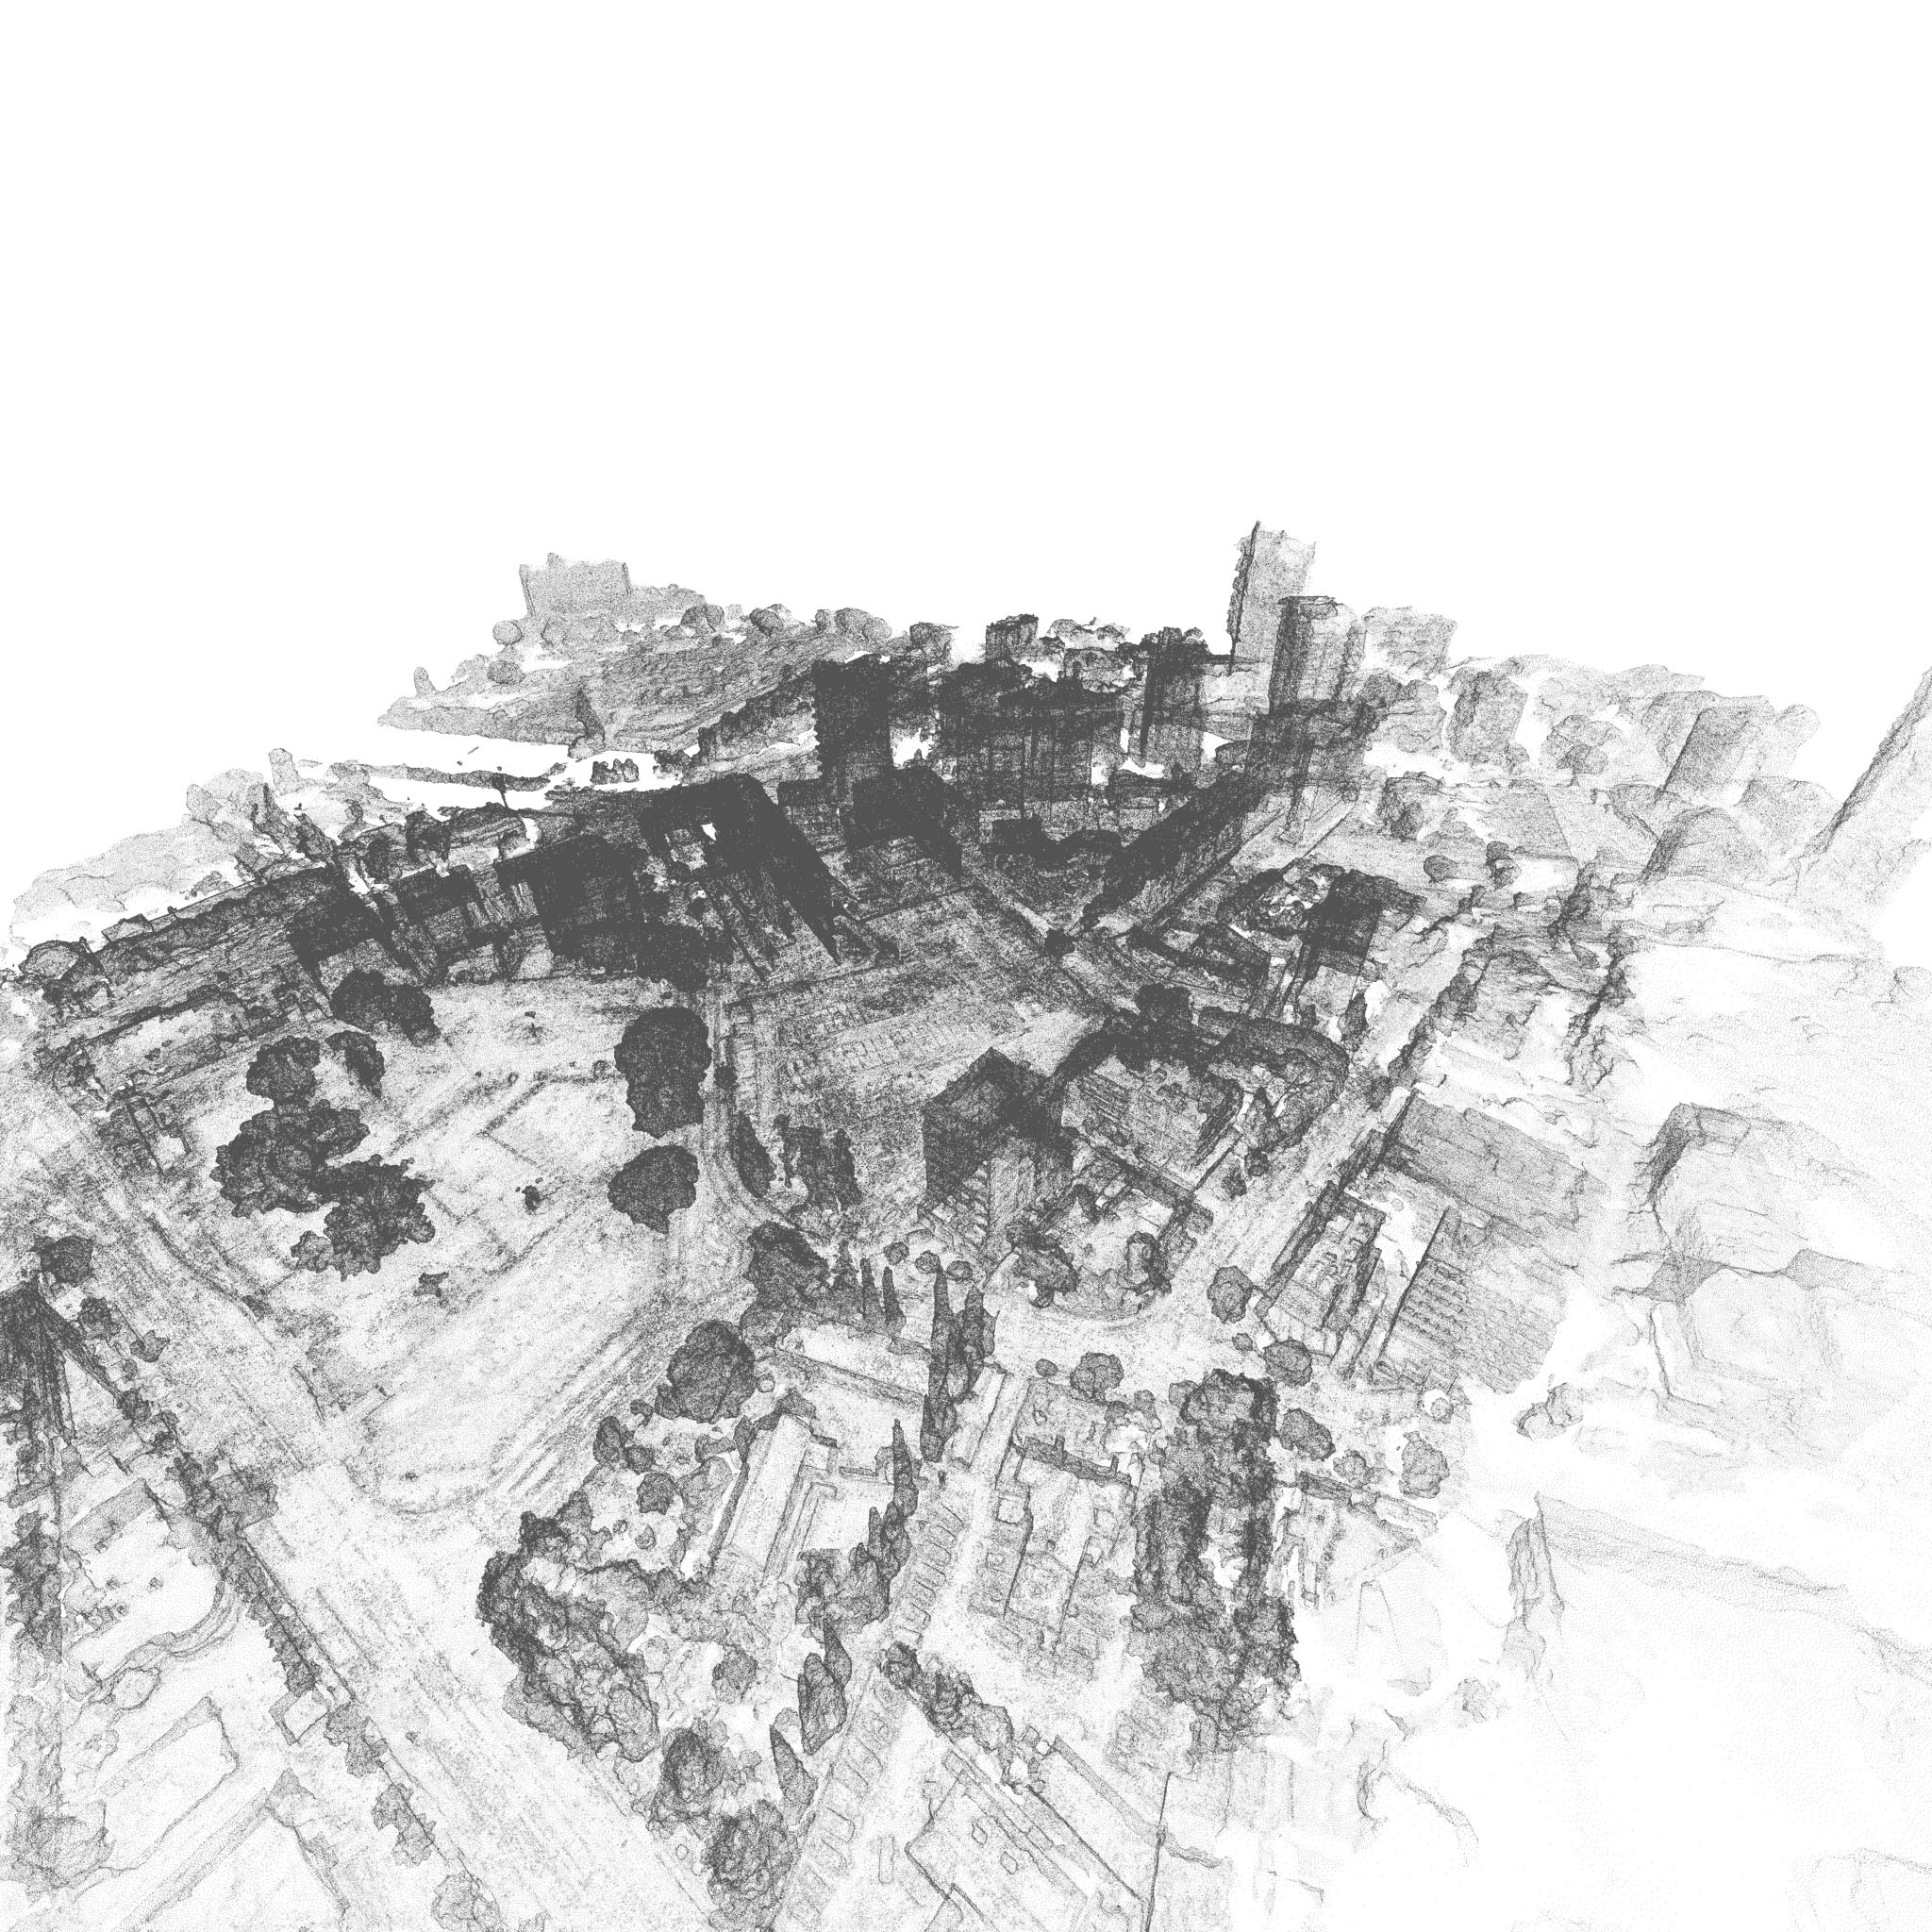
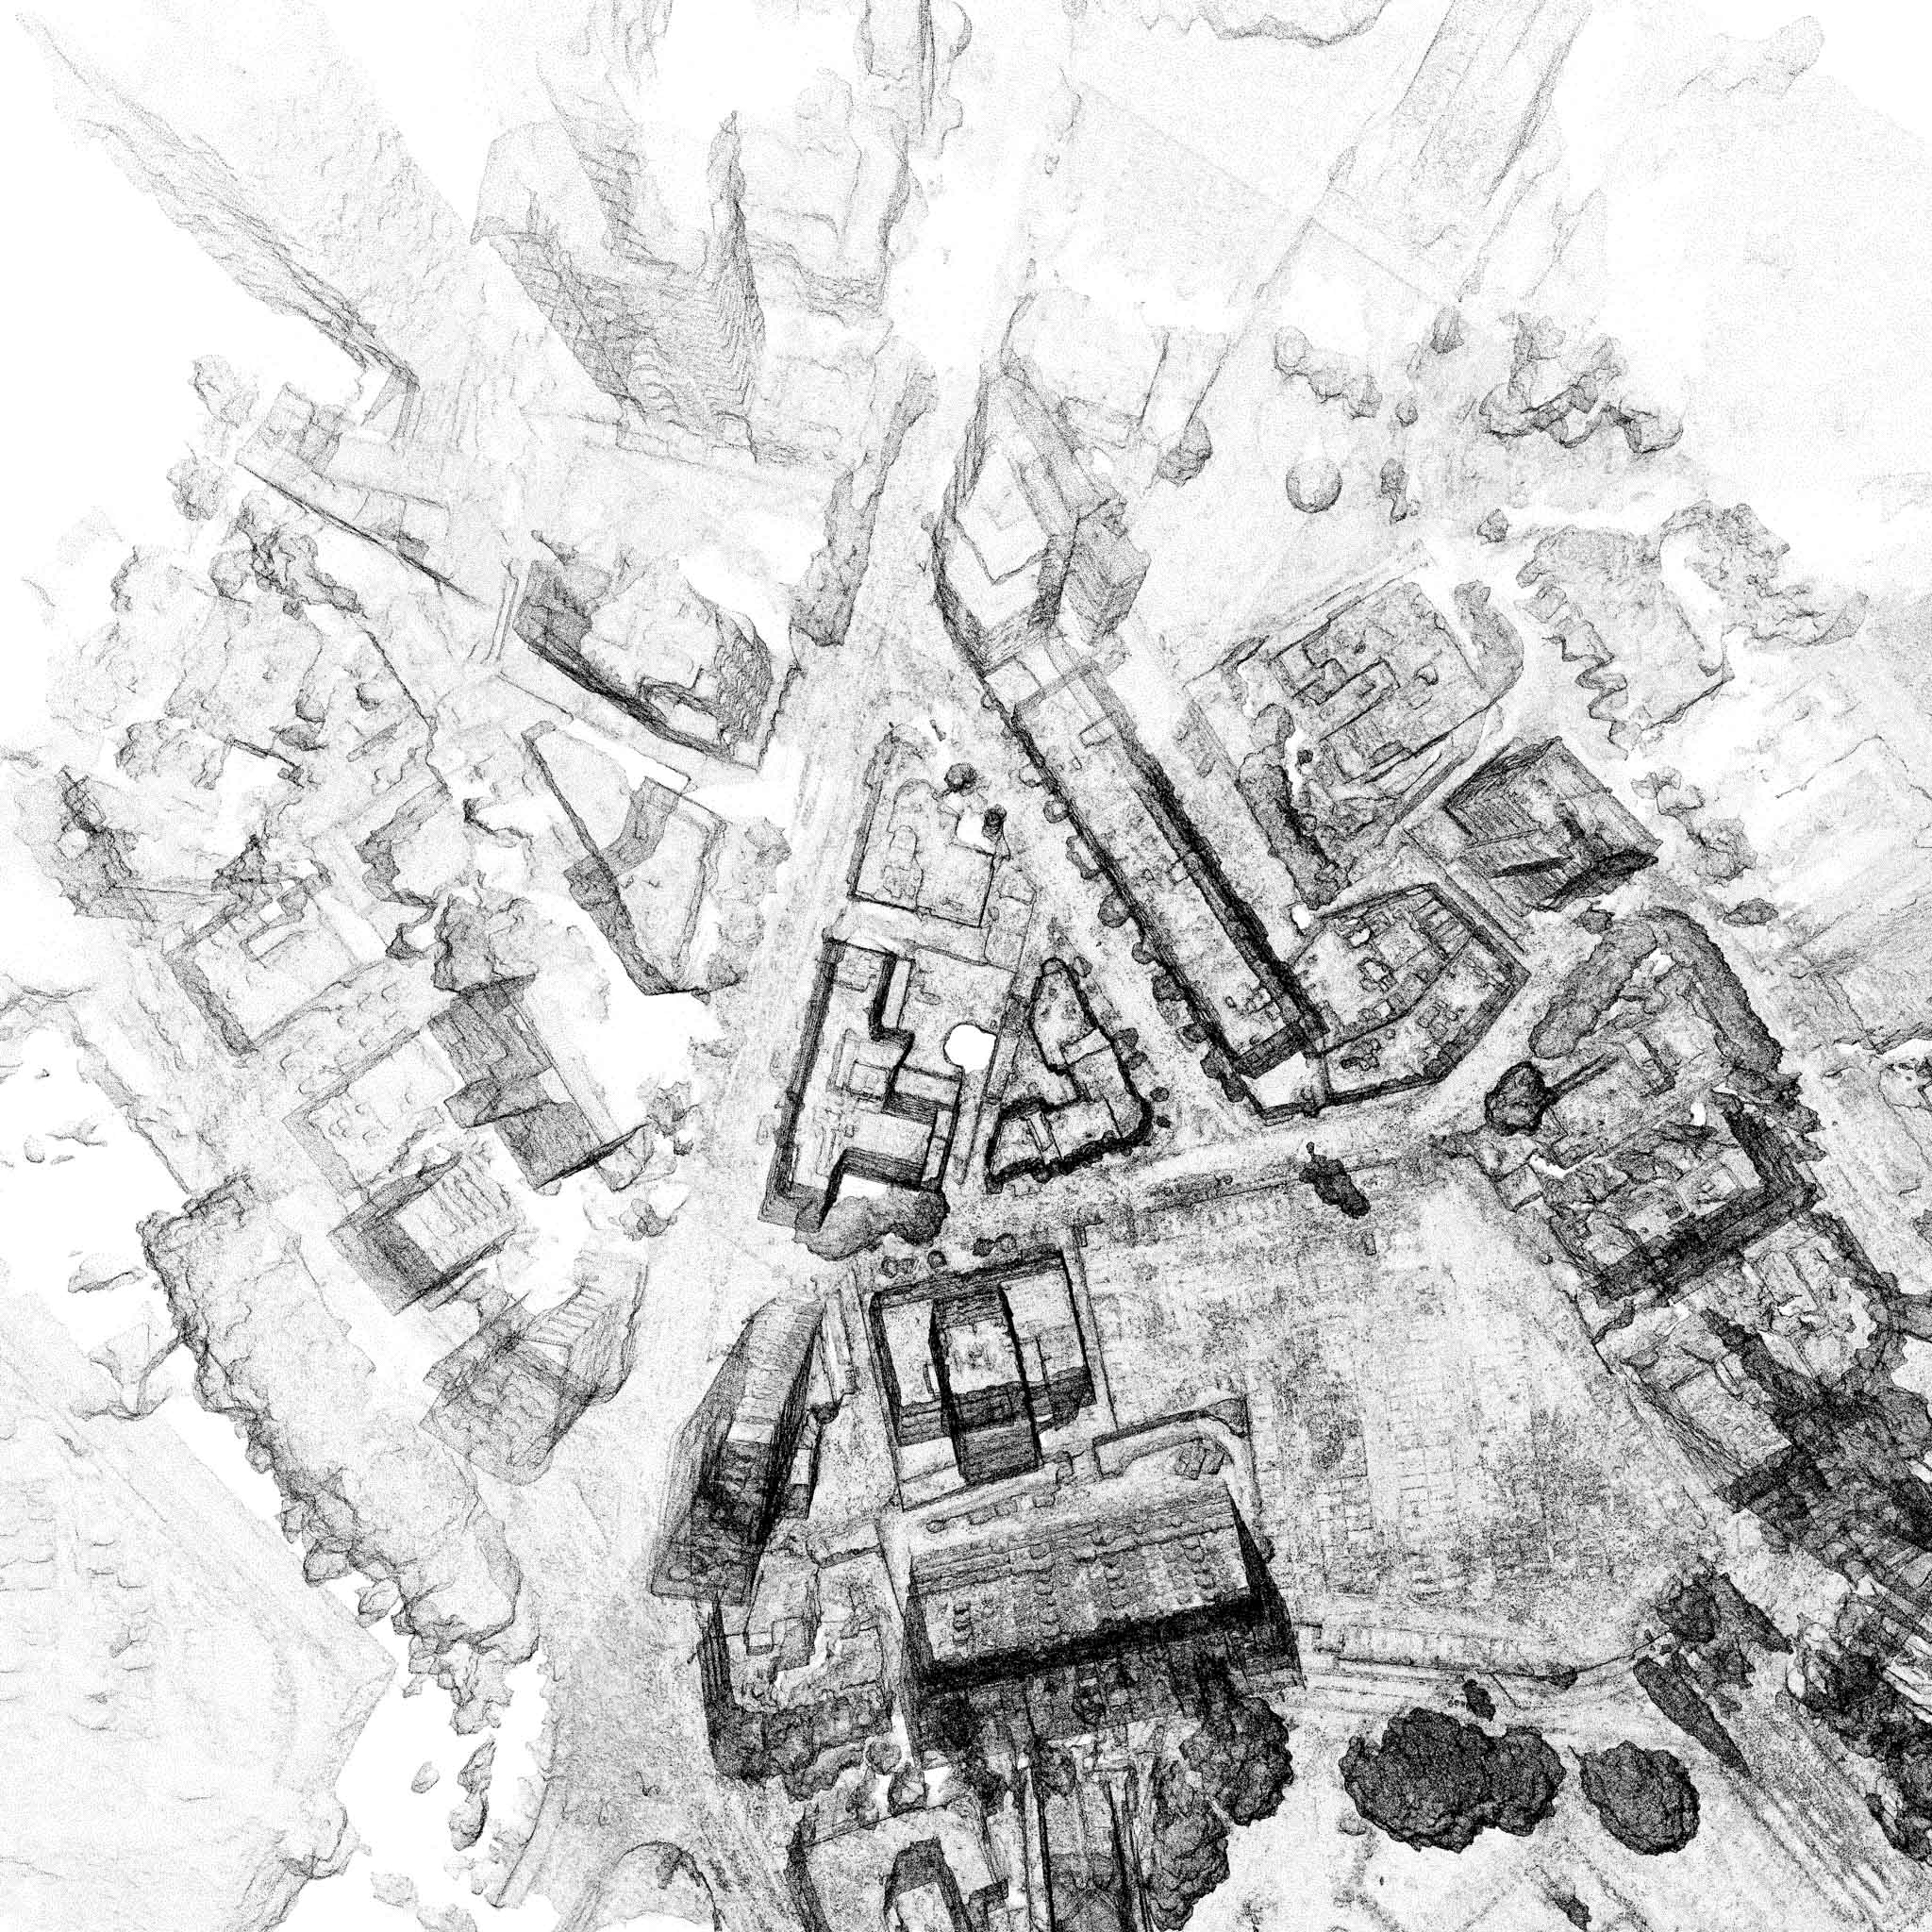
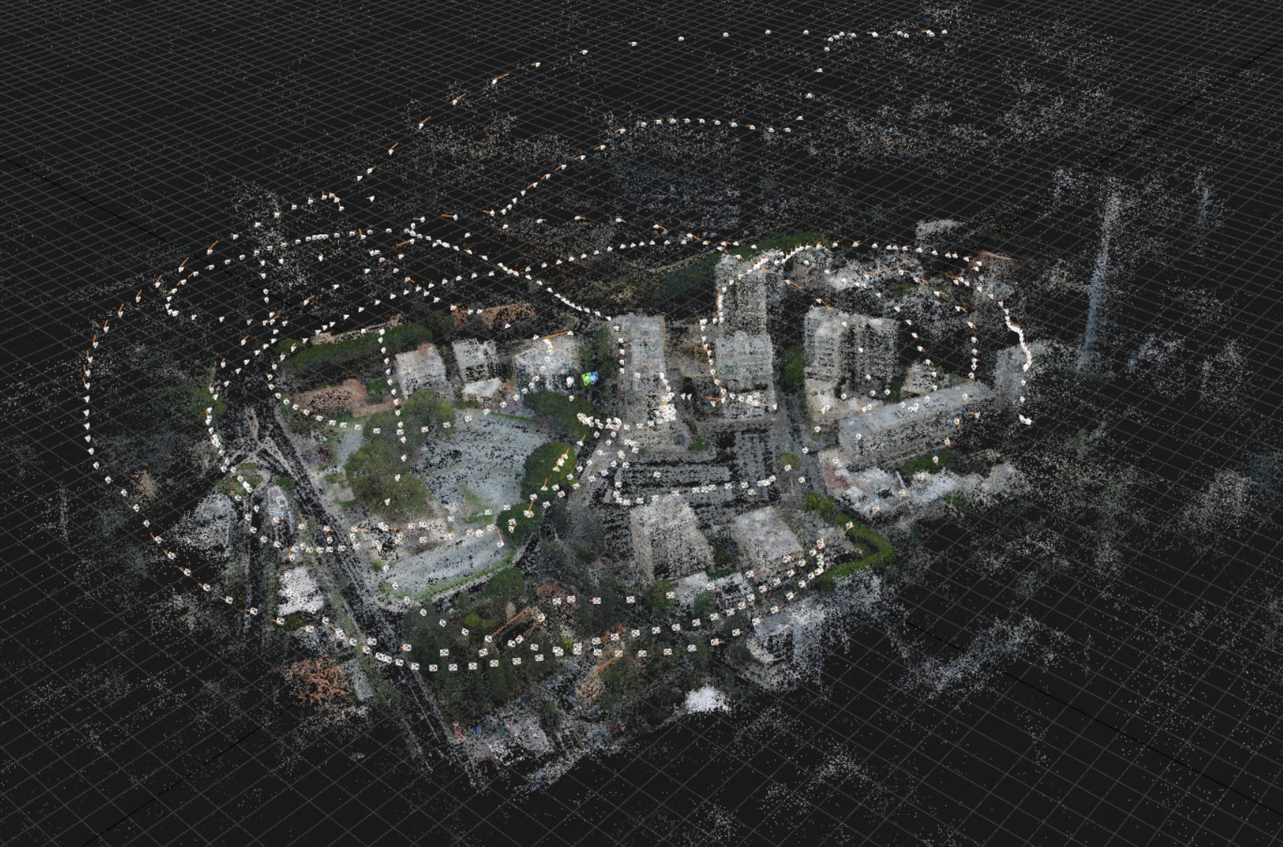
The drone carried out a total of 5 circular rotations with varying points of interest primarily focusing around the main street itself. A total of approximately 550 images were taken which were used to generate the following point clouds.
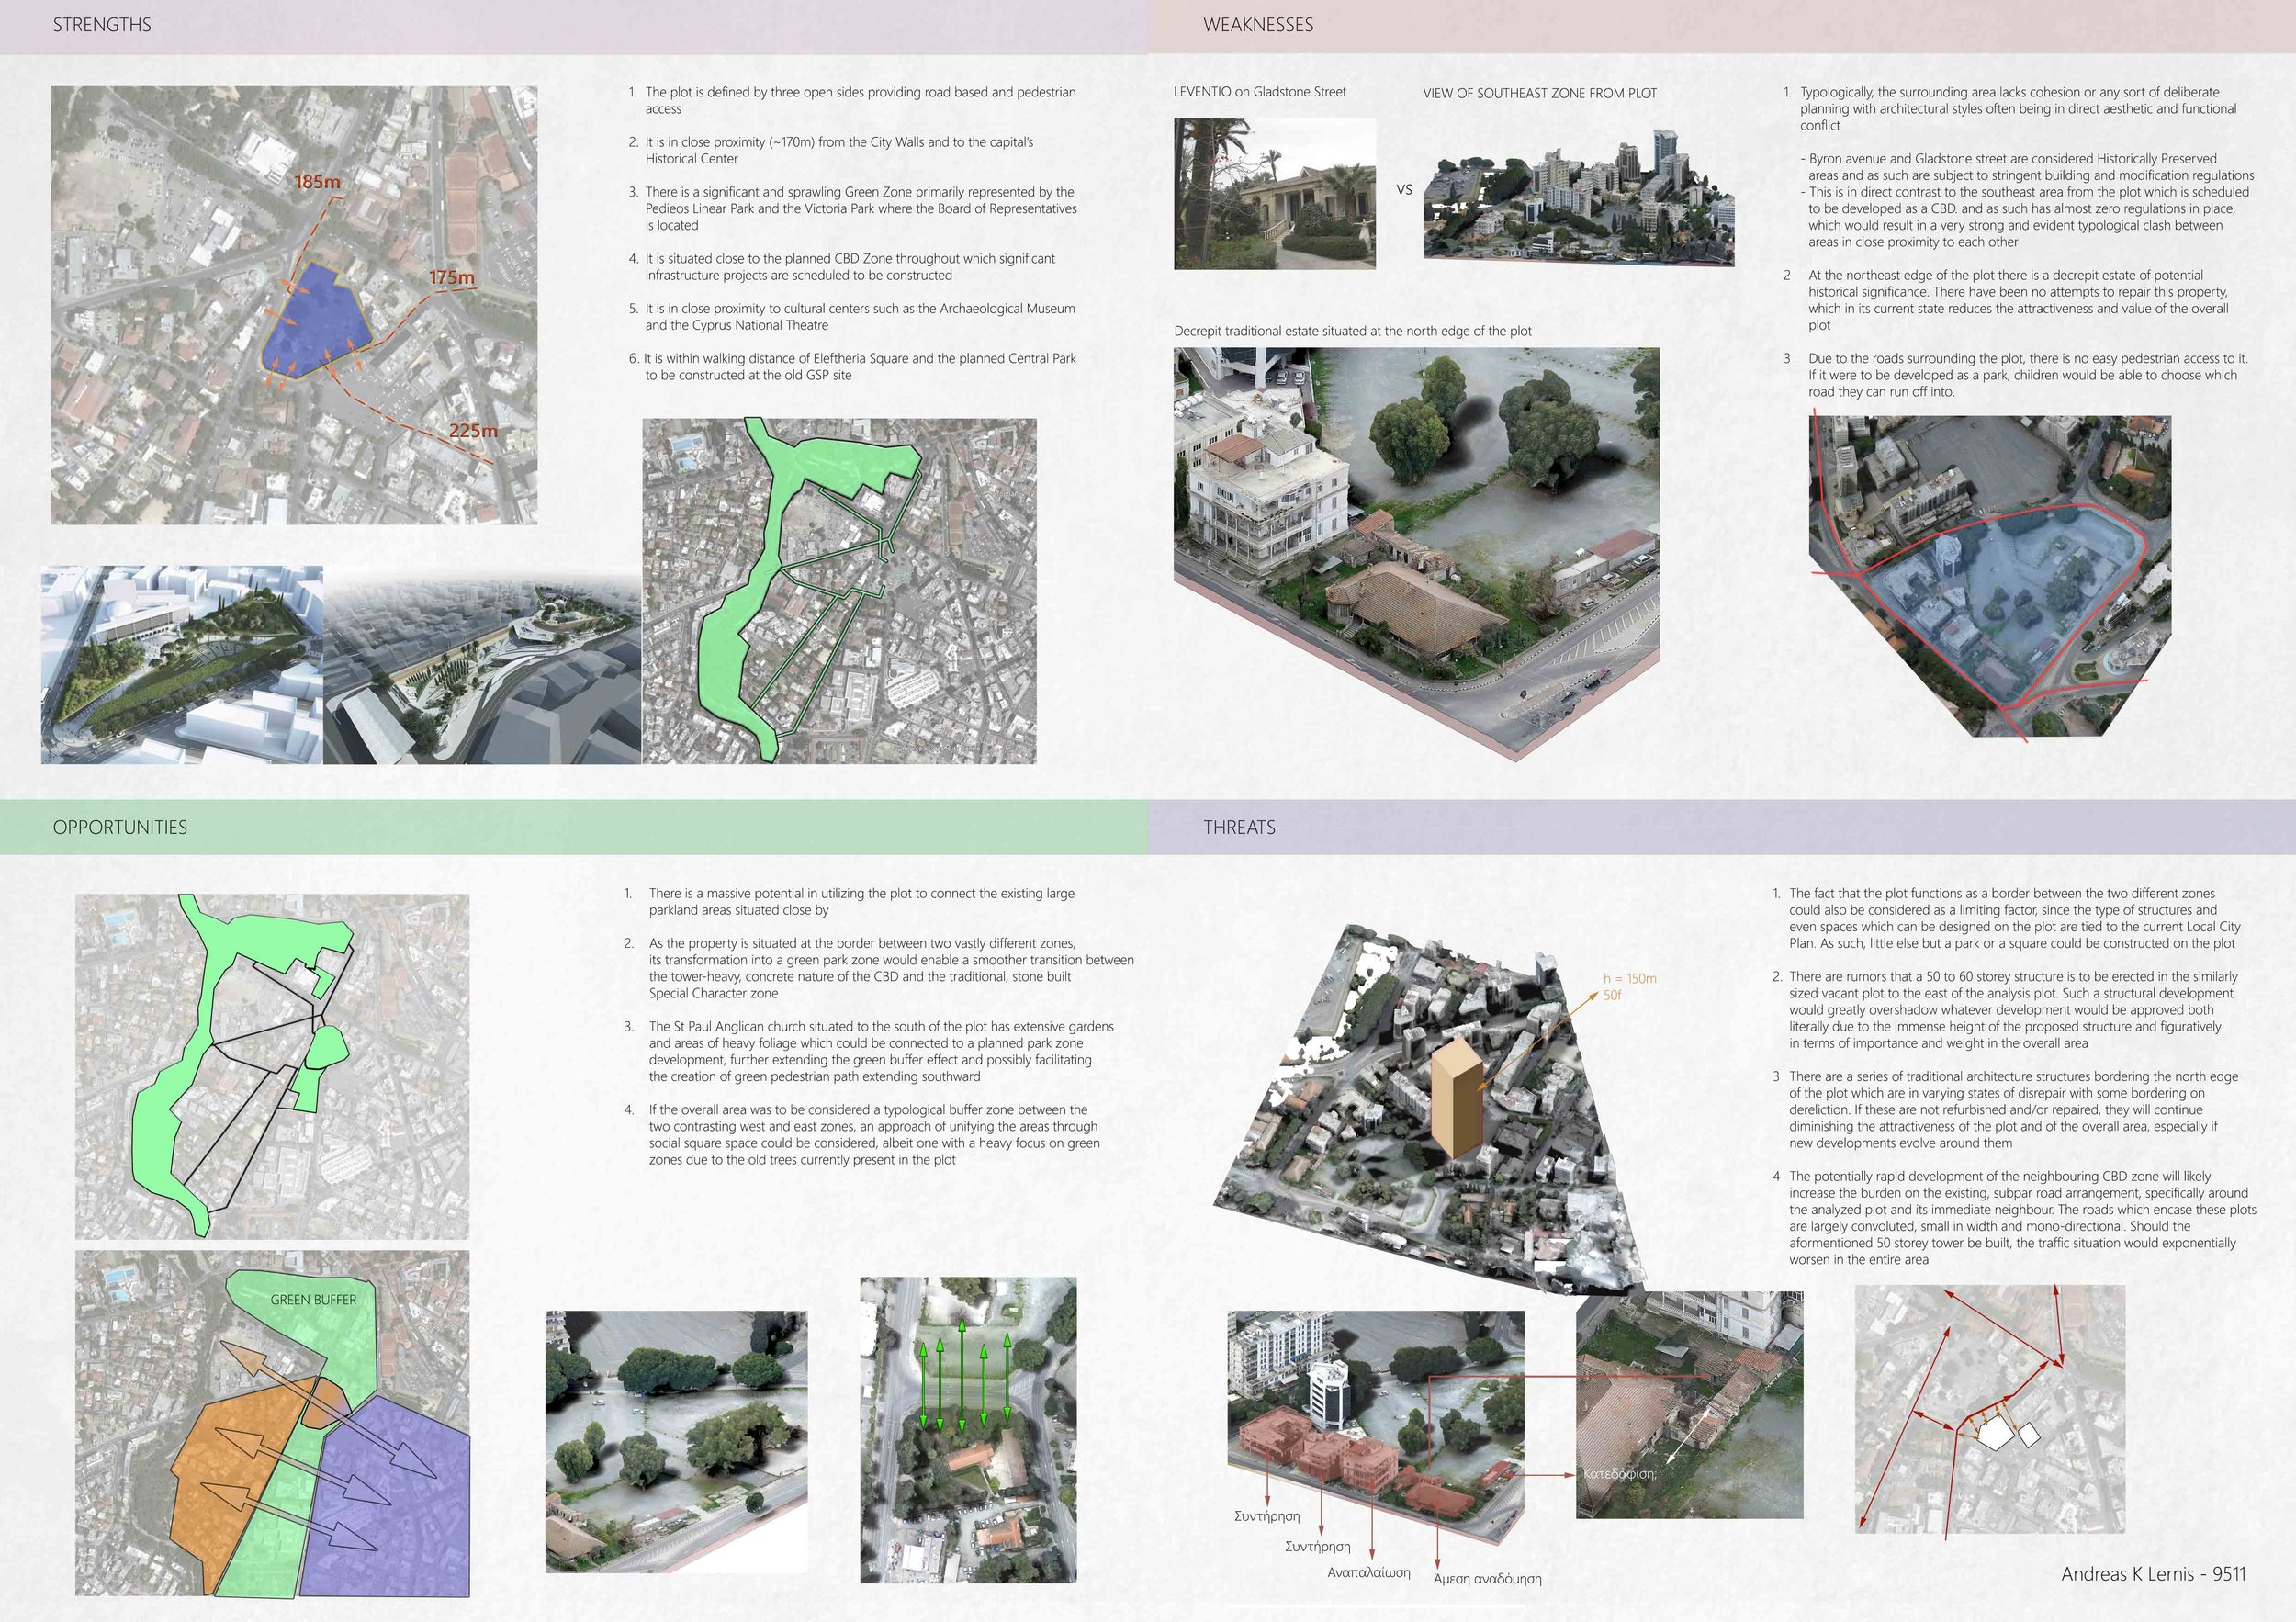
The point cloud was used in two different ways. Firstly a textured mesh was generated which was used to assess certain qualitative elements of the area which were clearly evident from the textured data. This involved recognizing the condition of certain buildings in the area and of carrying out some initial sun/shade simulations of how a tall (25+ floors) building could affect the overall area.
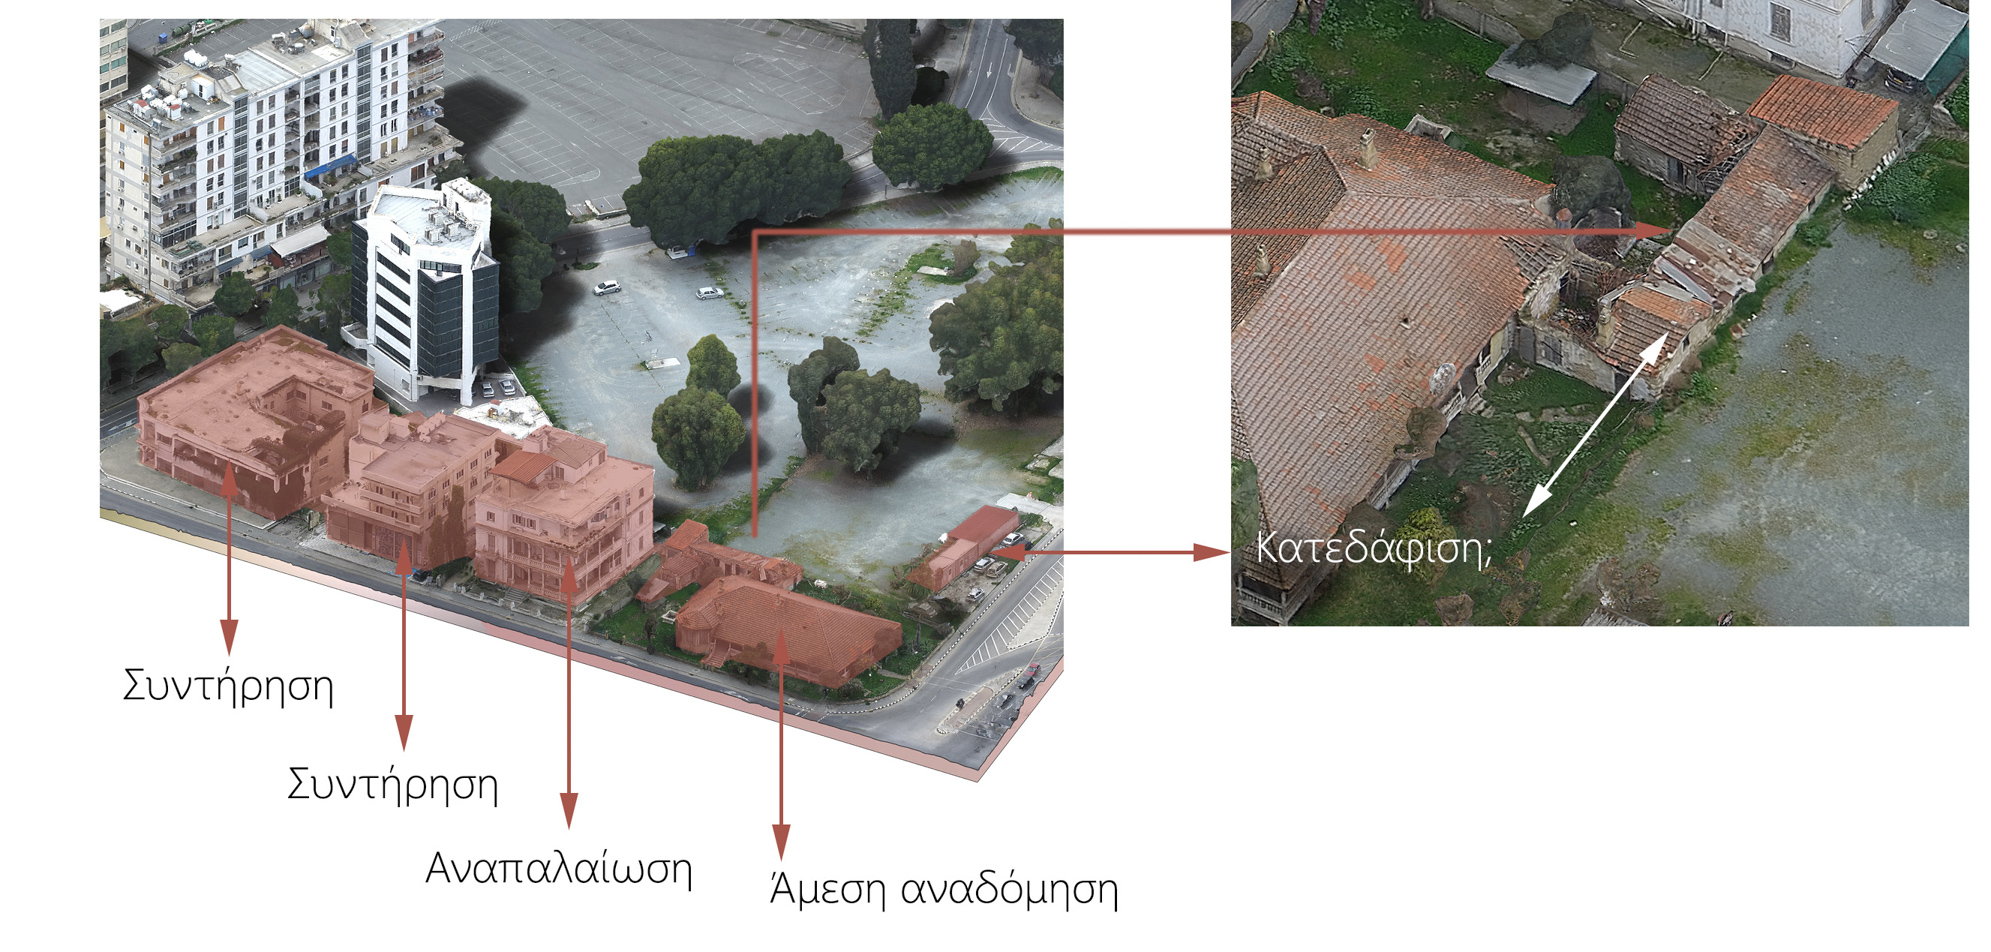
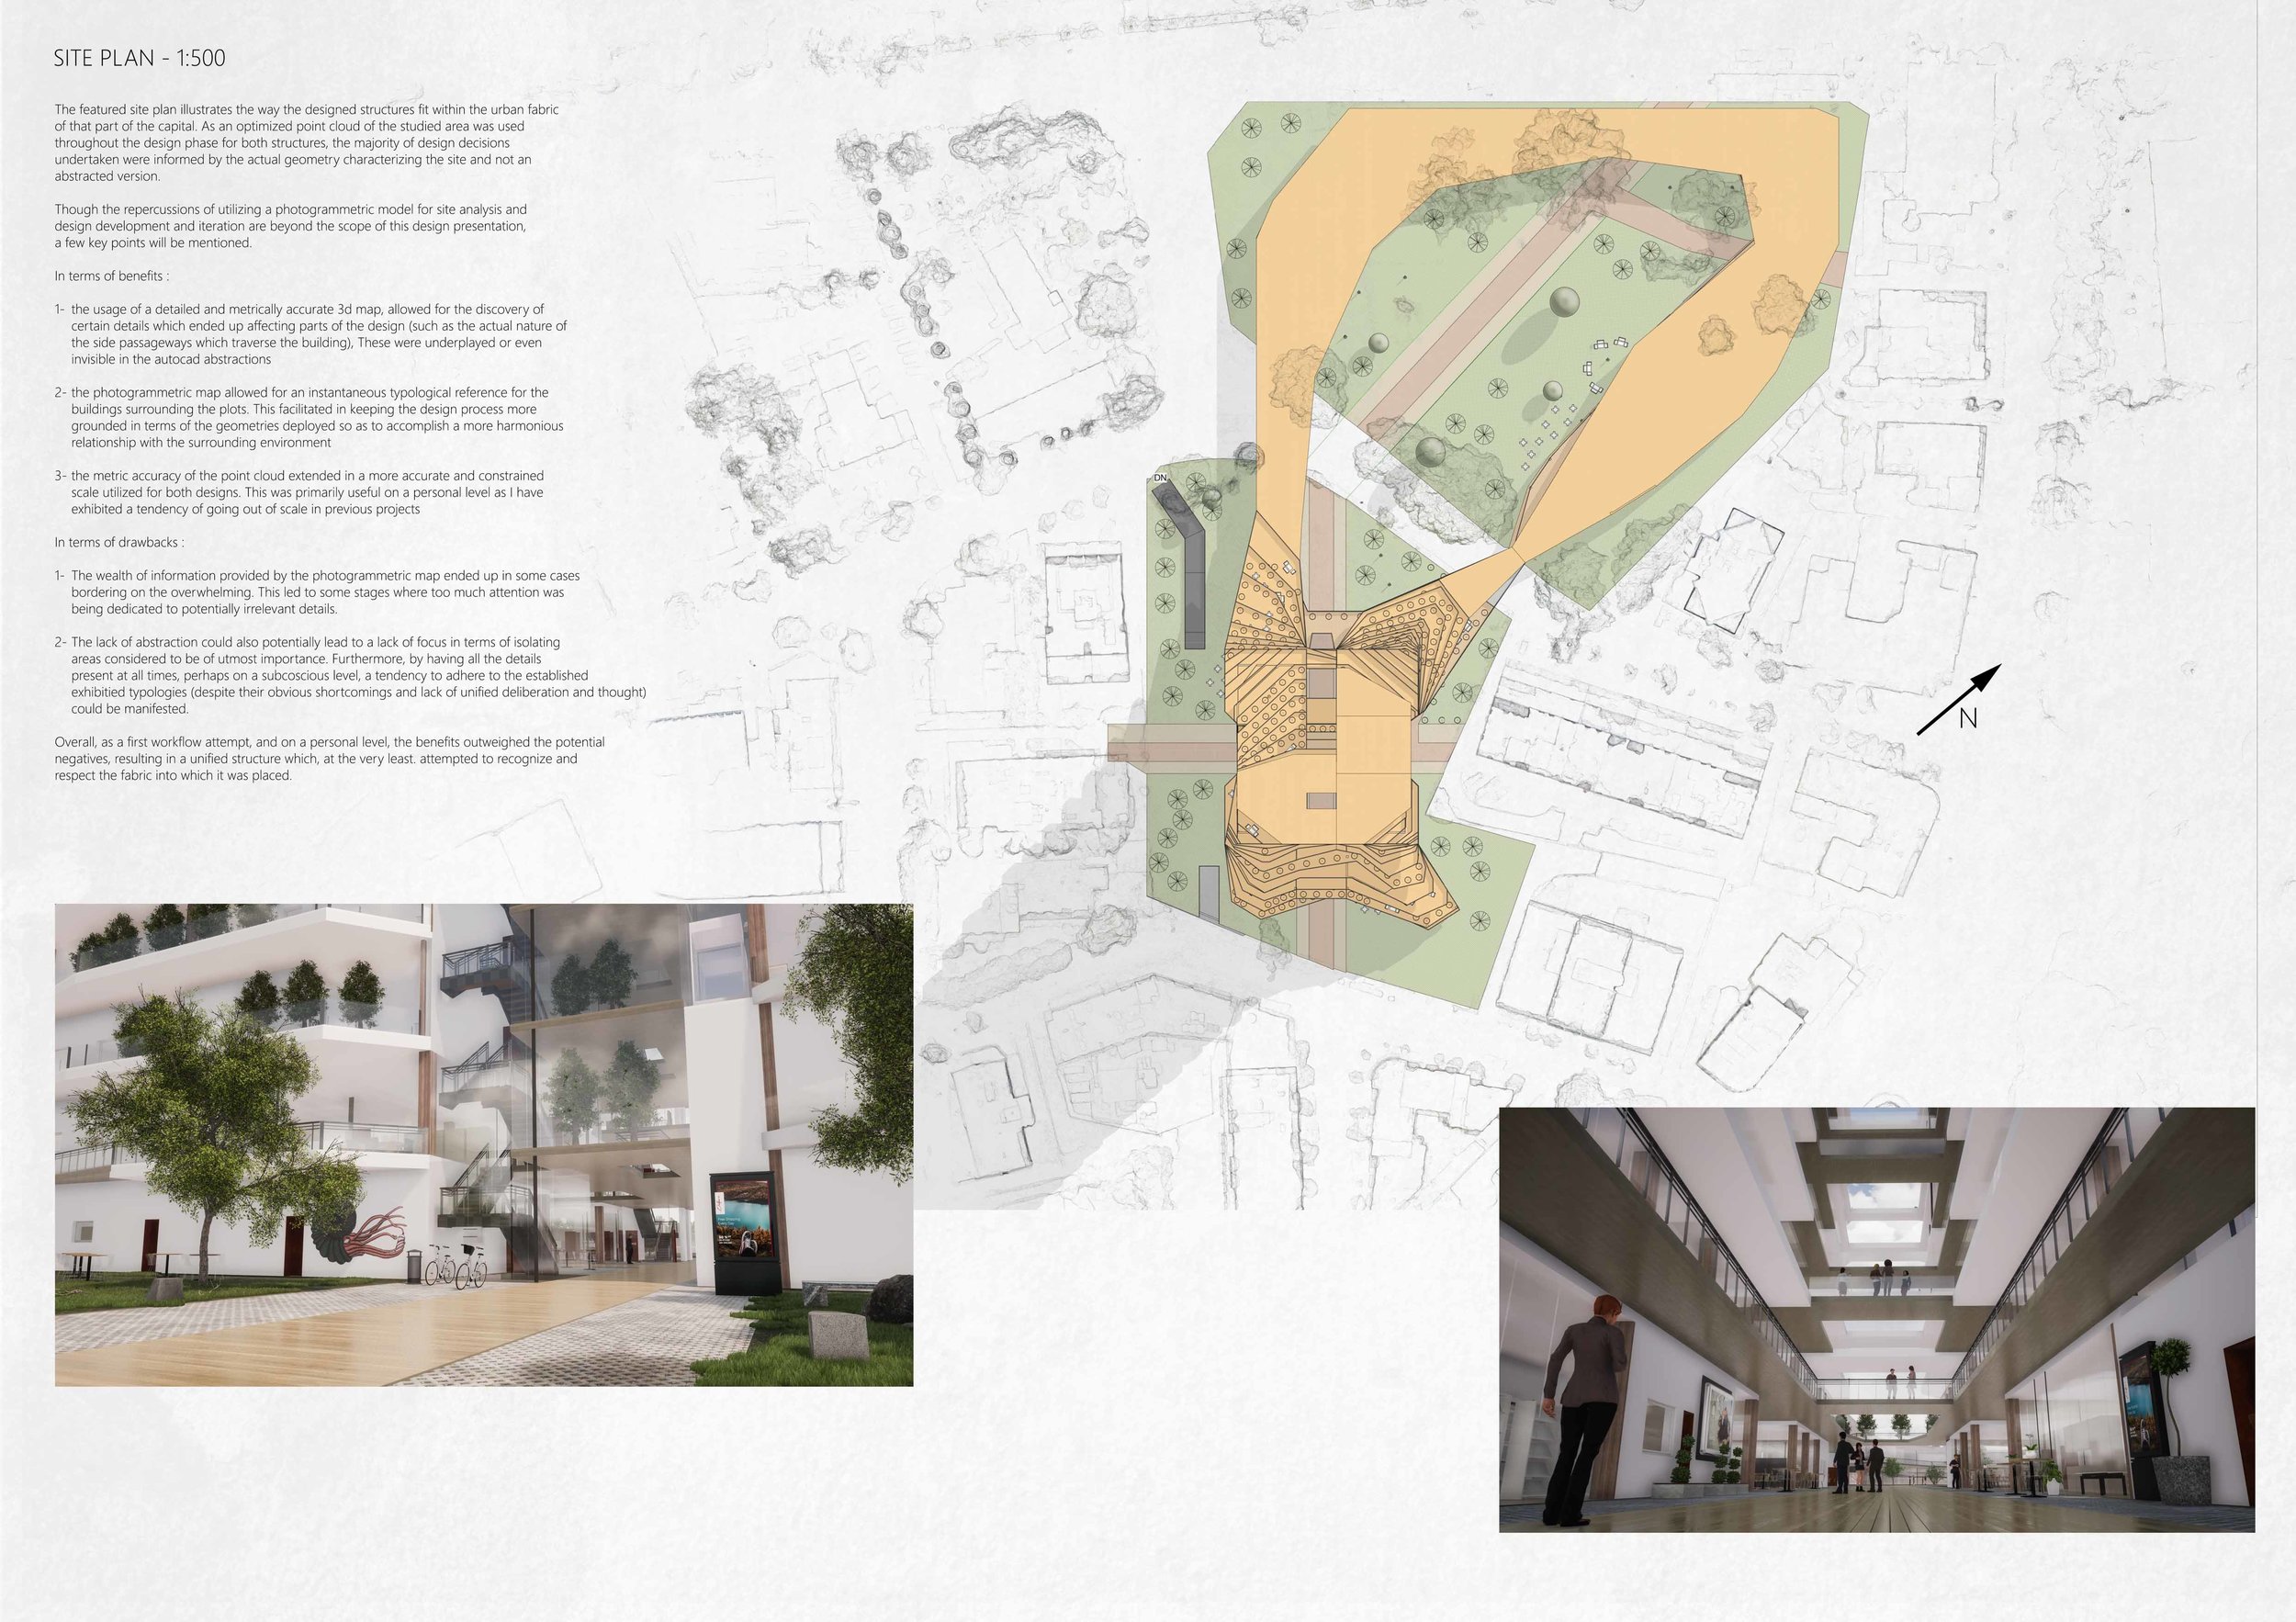
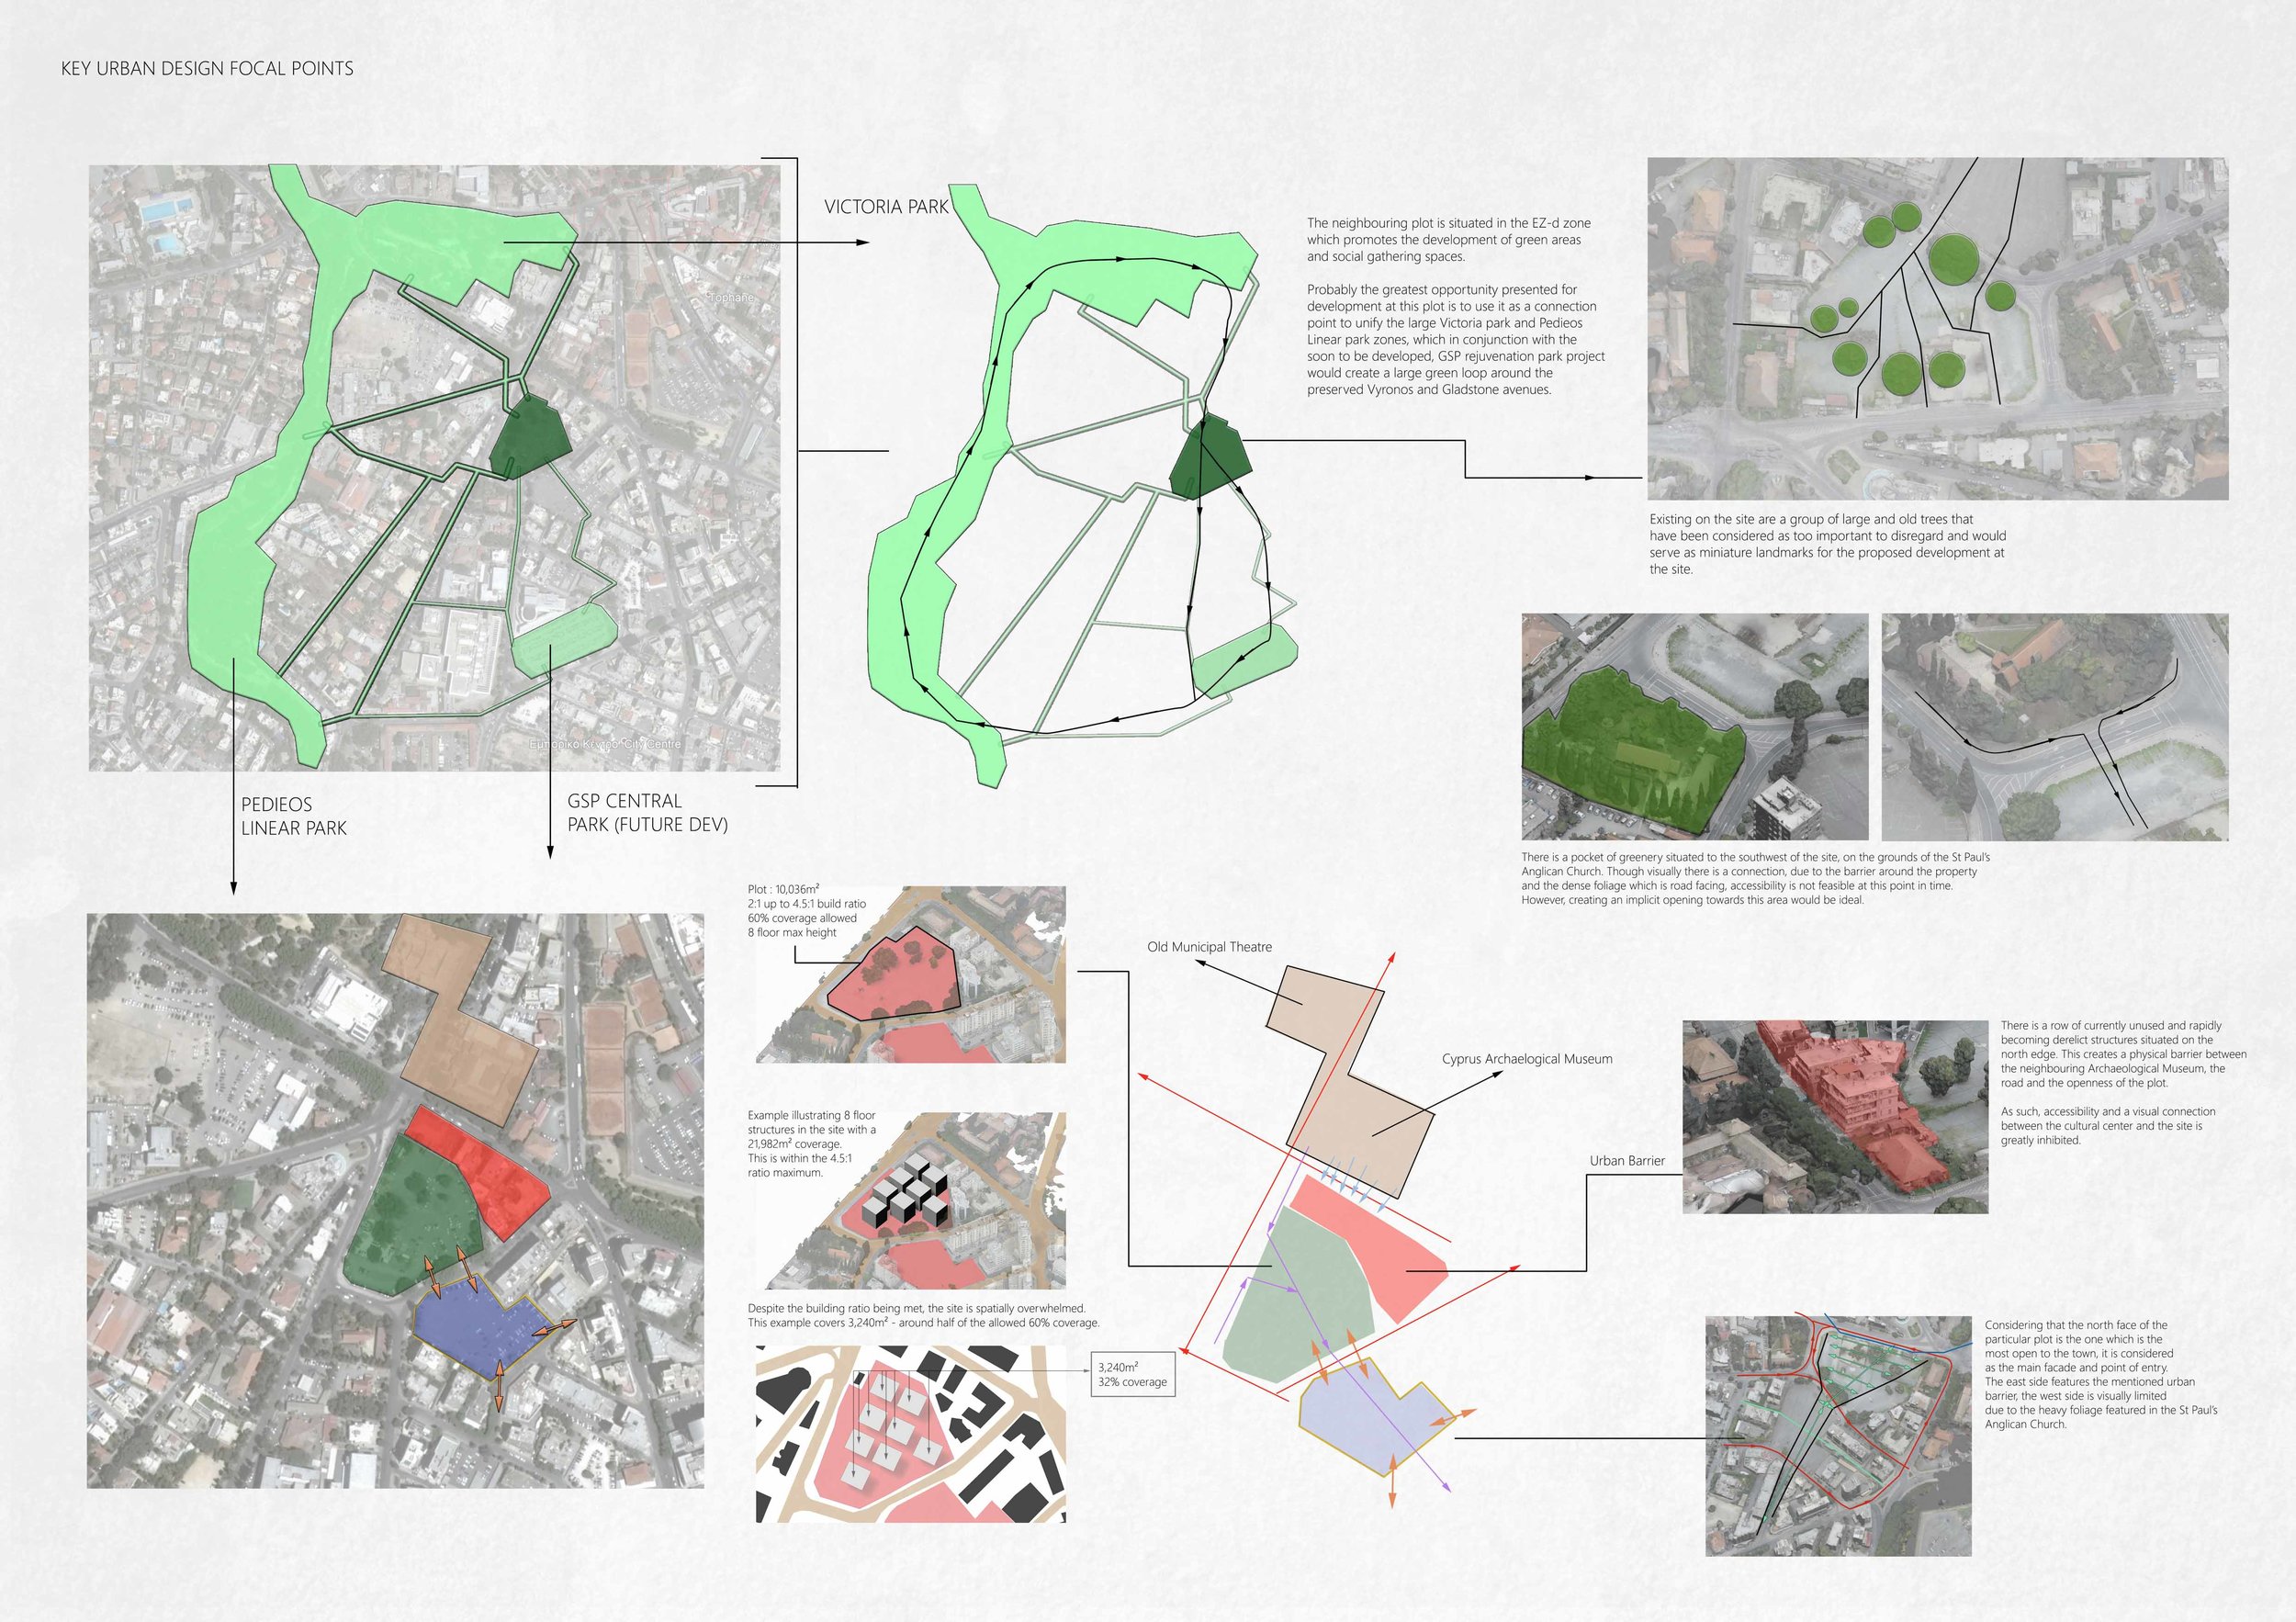
As the design would involve the designing of a circular urban park in the north plot, the row of buildings facing the north-east border was key, as it acts as a barrier, both visually and traversal-wise. Through using the generated model, the condition that these buildings are currently in could be determined, and a possible path was designed which would involve the partial demolition of a series of decrepit shacks attached to the corner building.
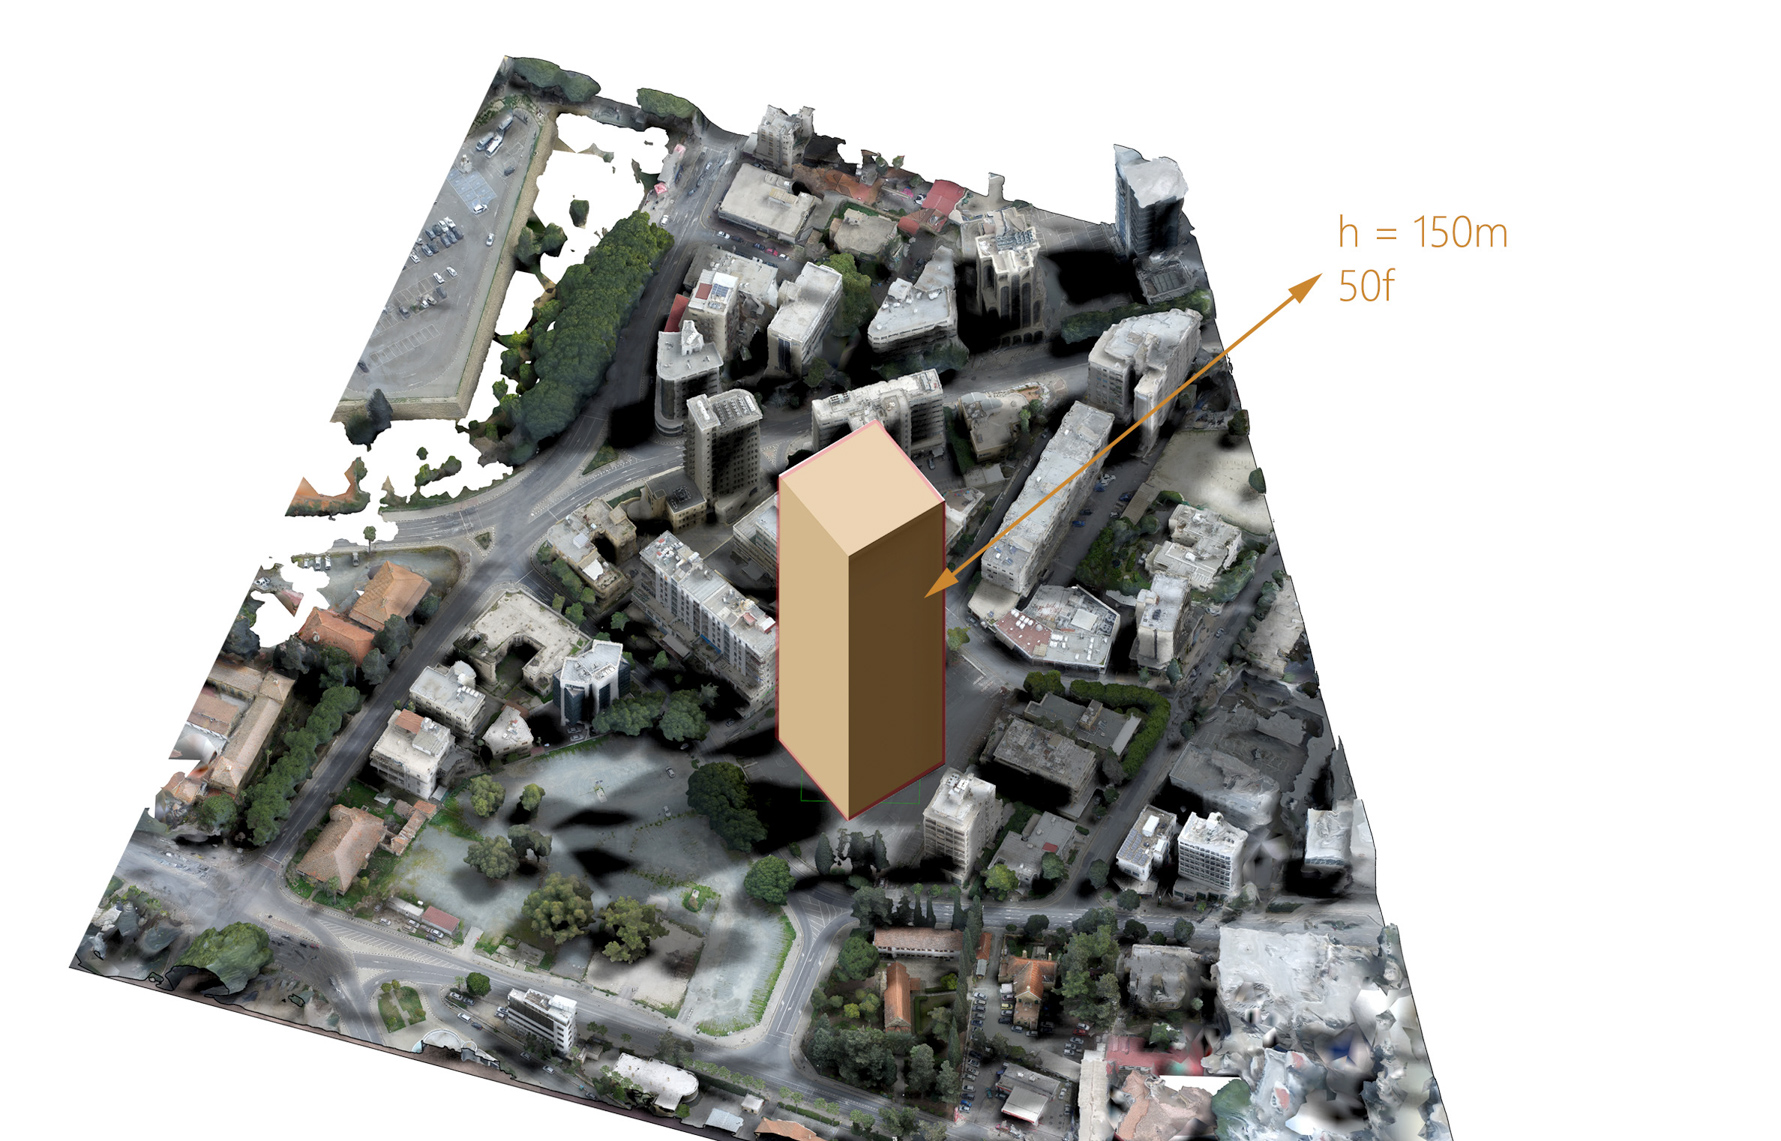
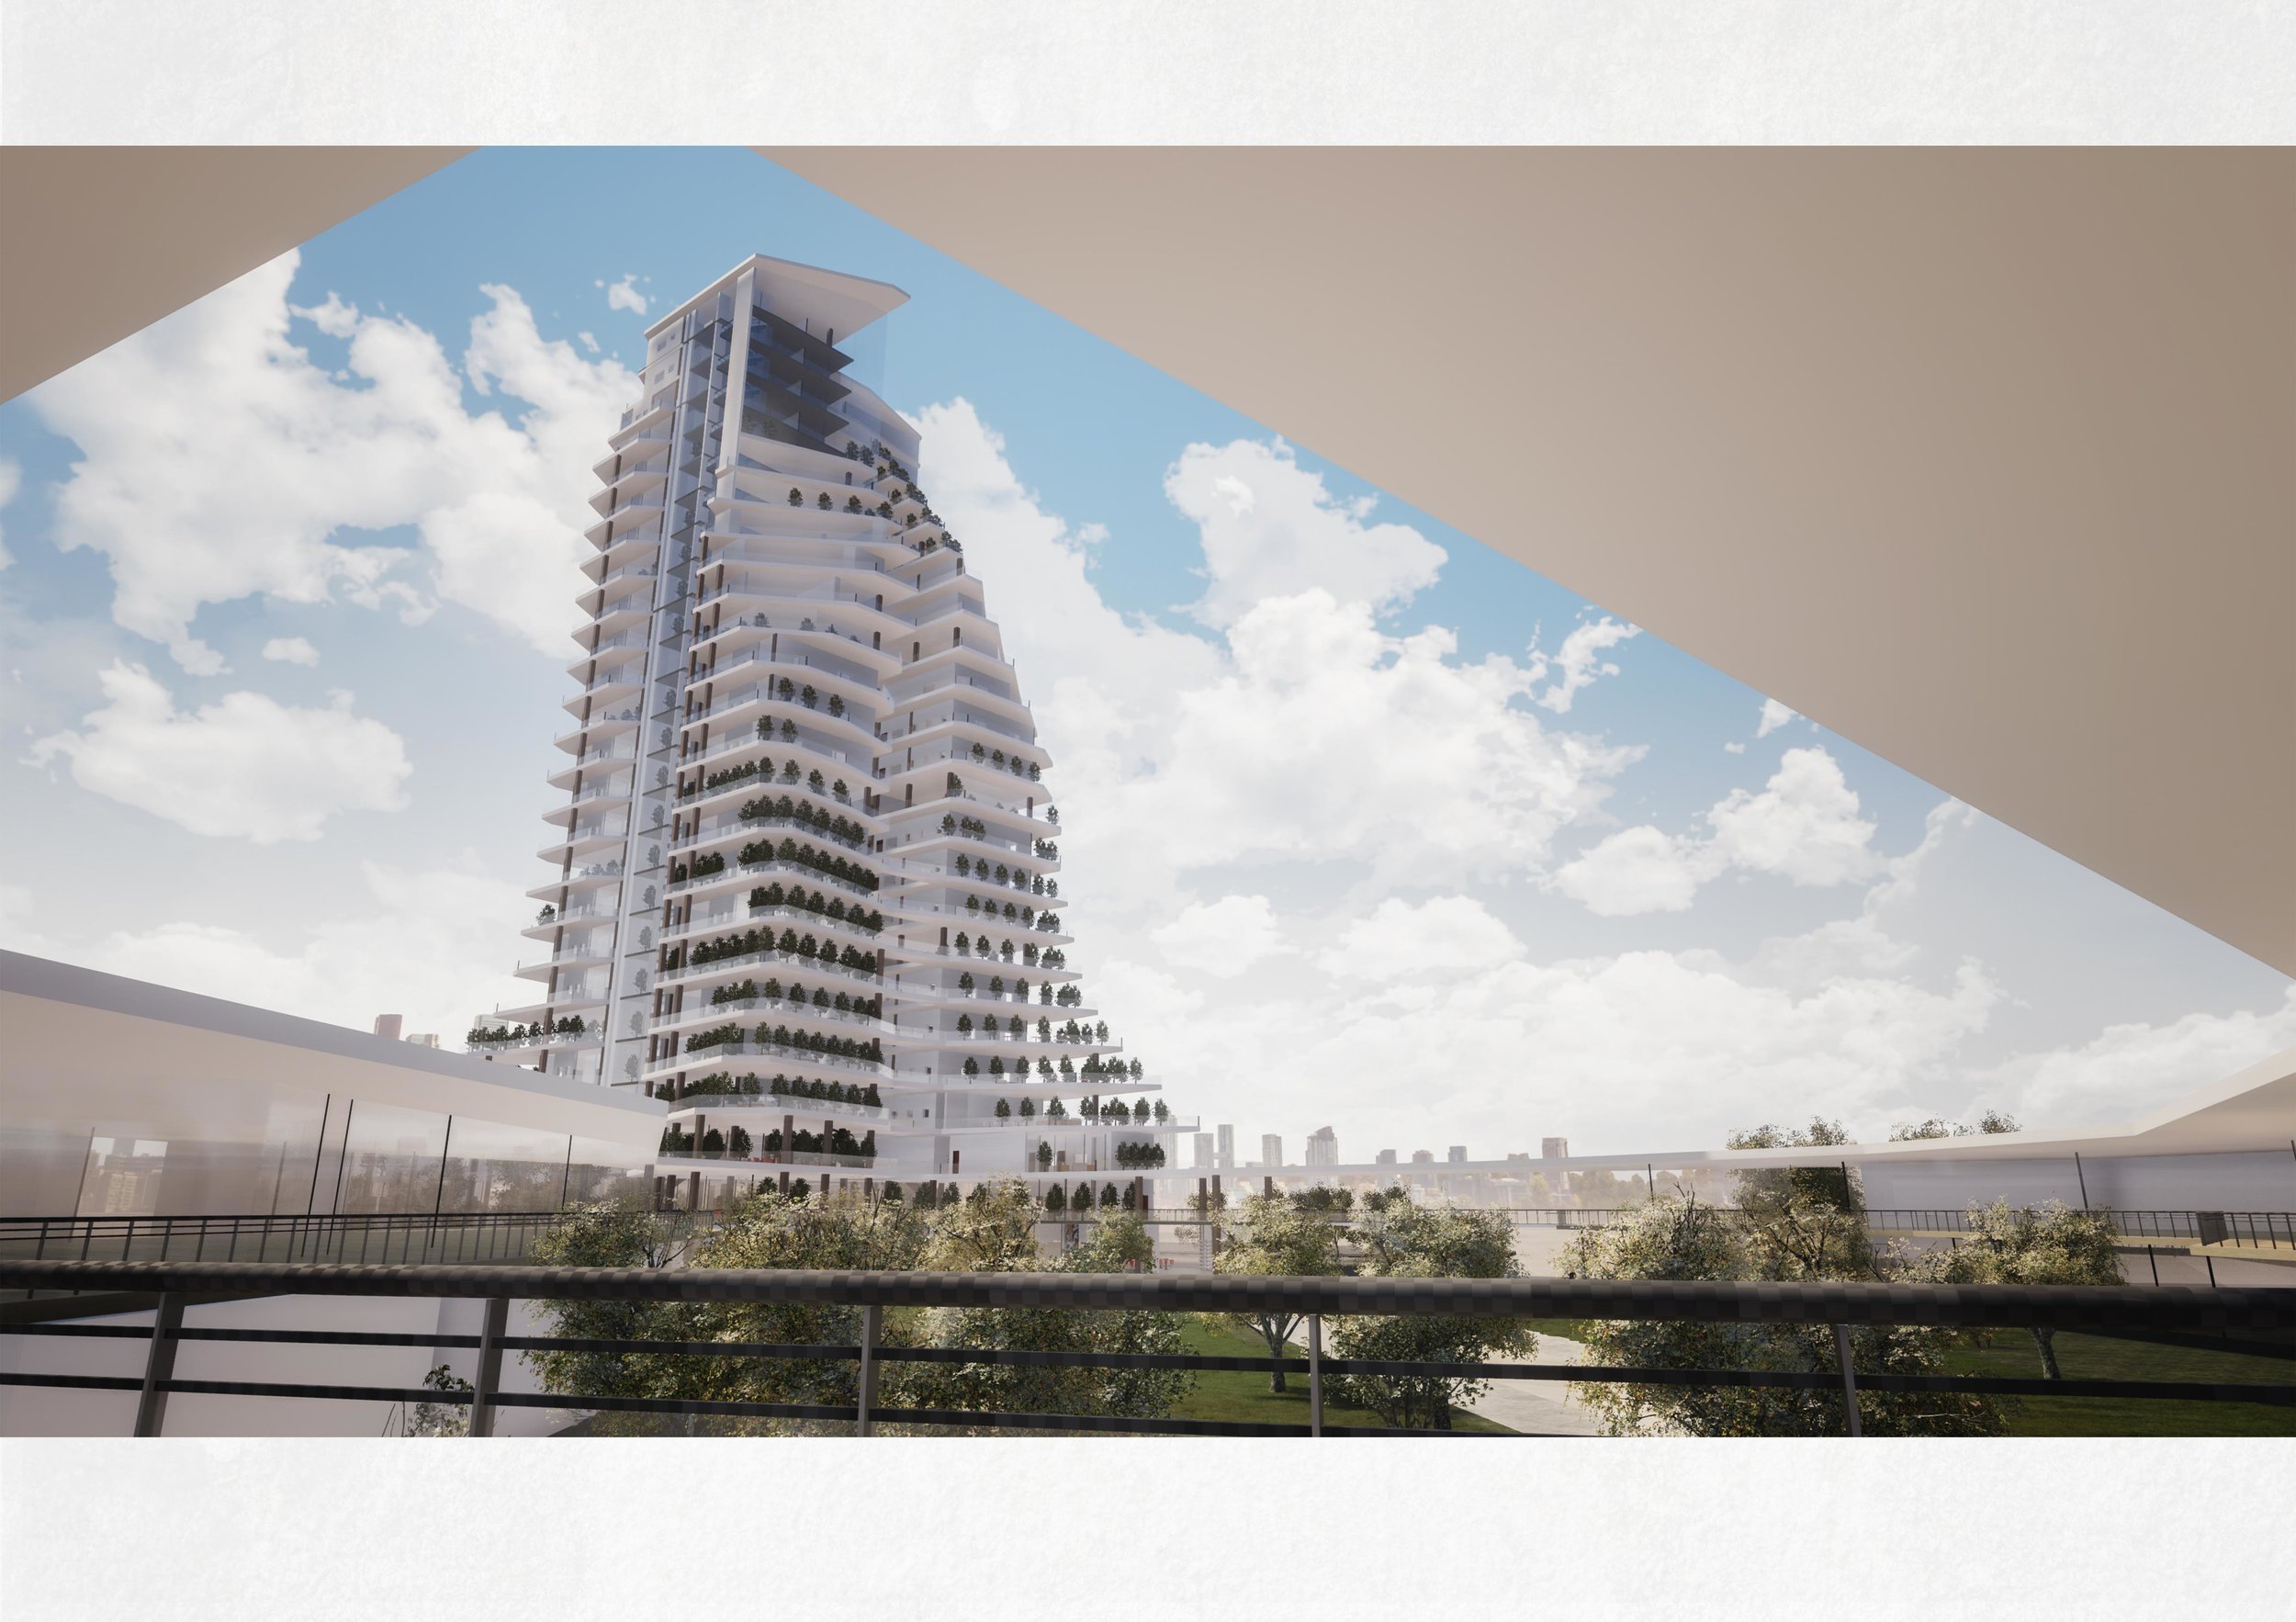
The placement of a large, monolithic volume in the south plot, where the tall, residential building was to be designed in, illustrated the breadth of the shadow that such a structure would cast on the urban park. As such, it was decided from this early point, that whatever structure was to be designed, would feature more transparent elements so as to mitigate such an oppressive, solid shadow.
The next stage involved outlining and creating section plans from this 3D view.
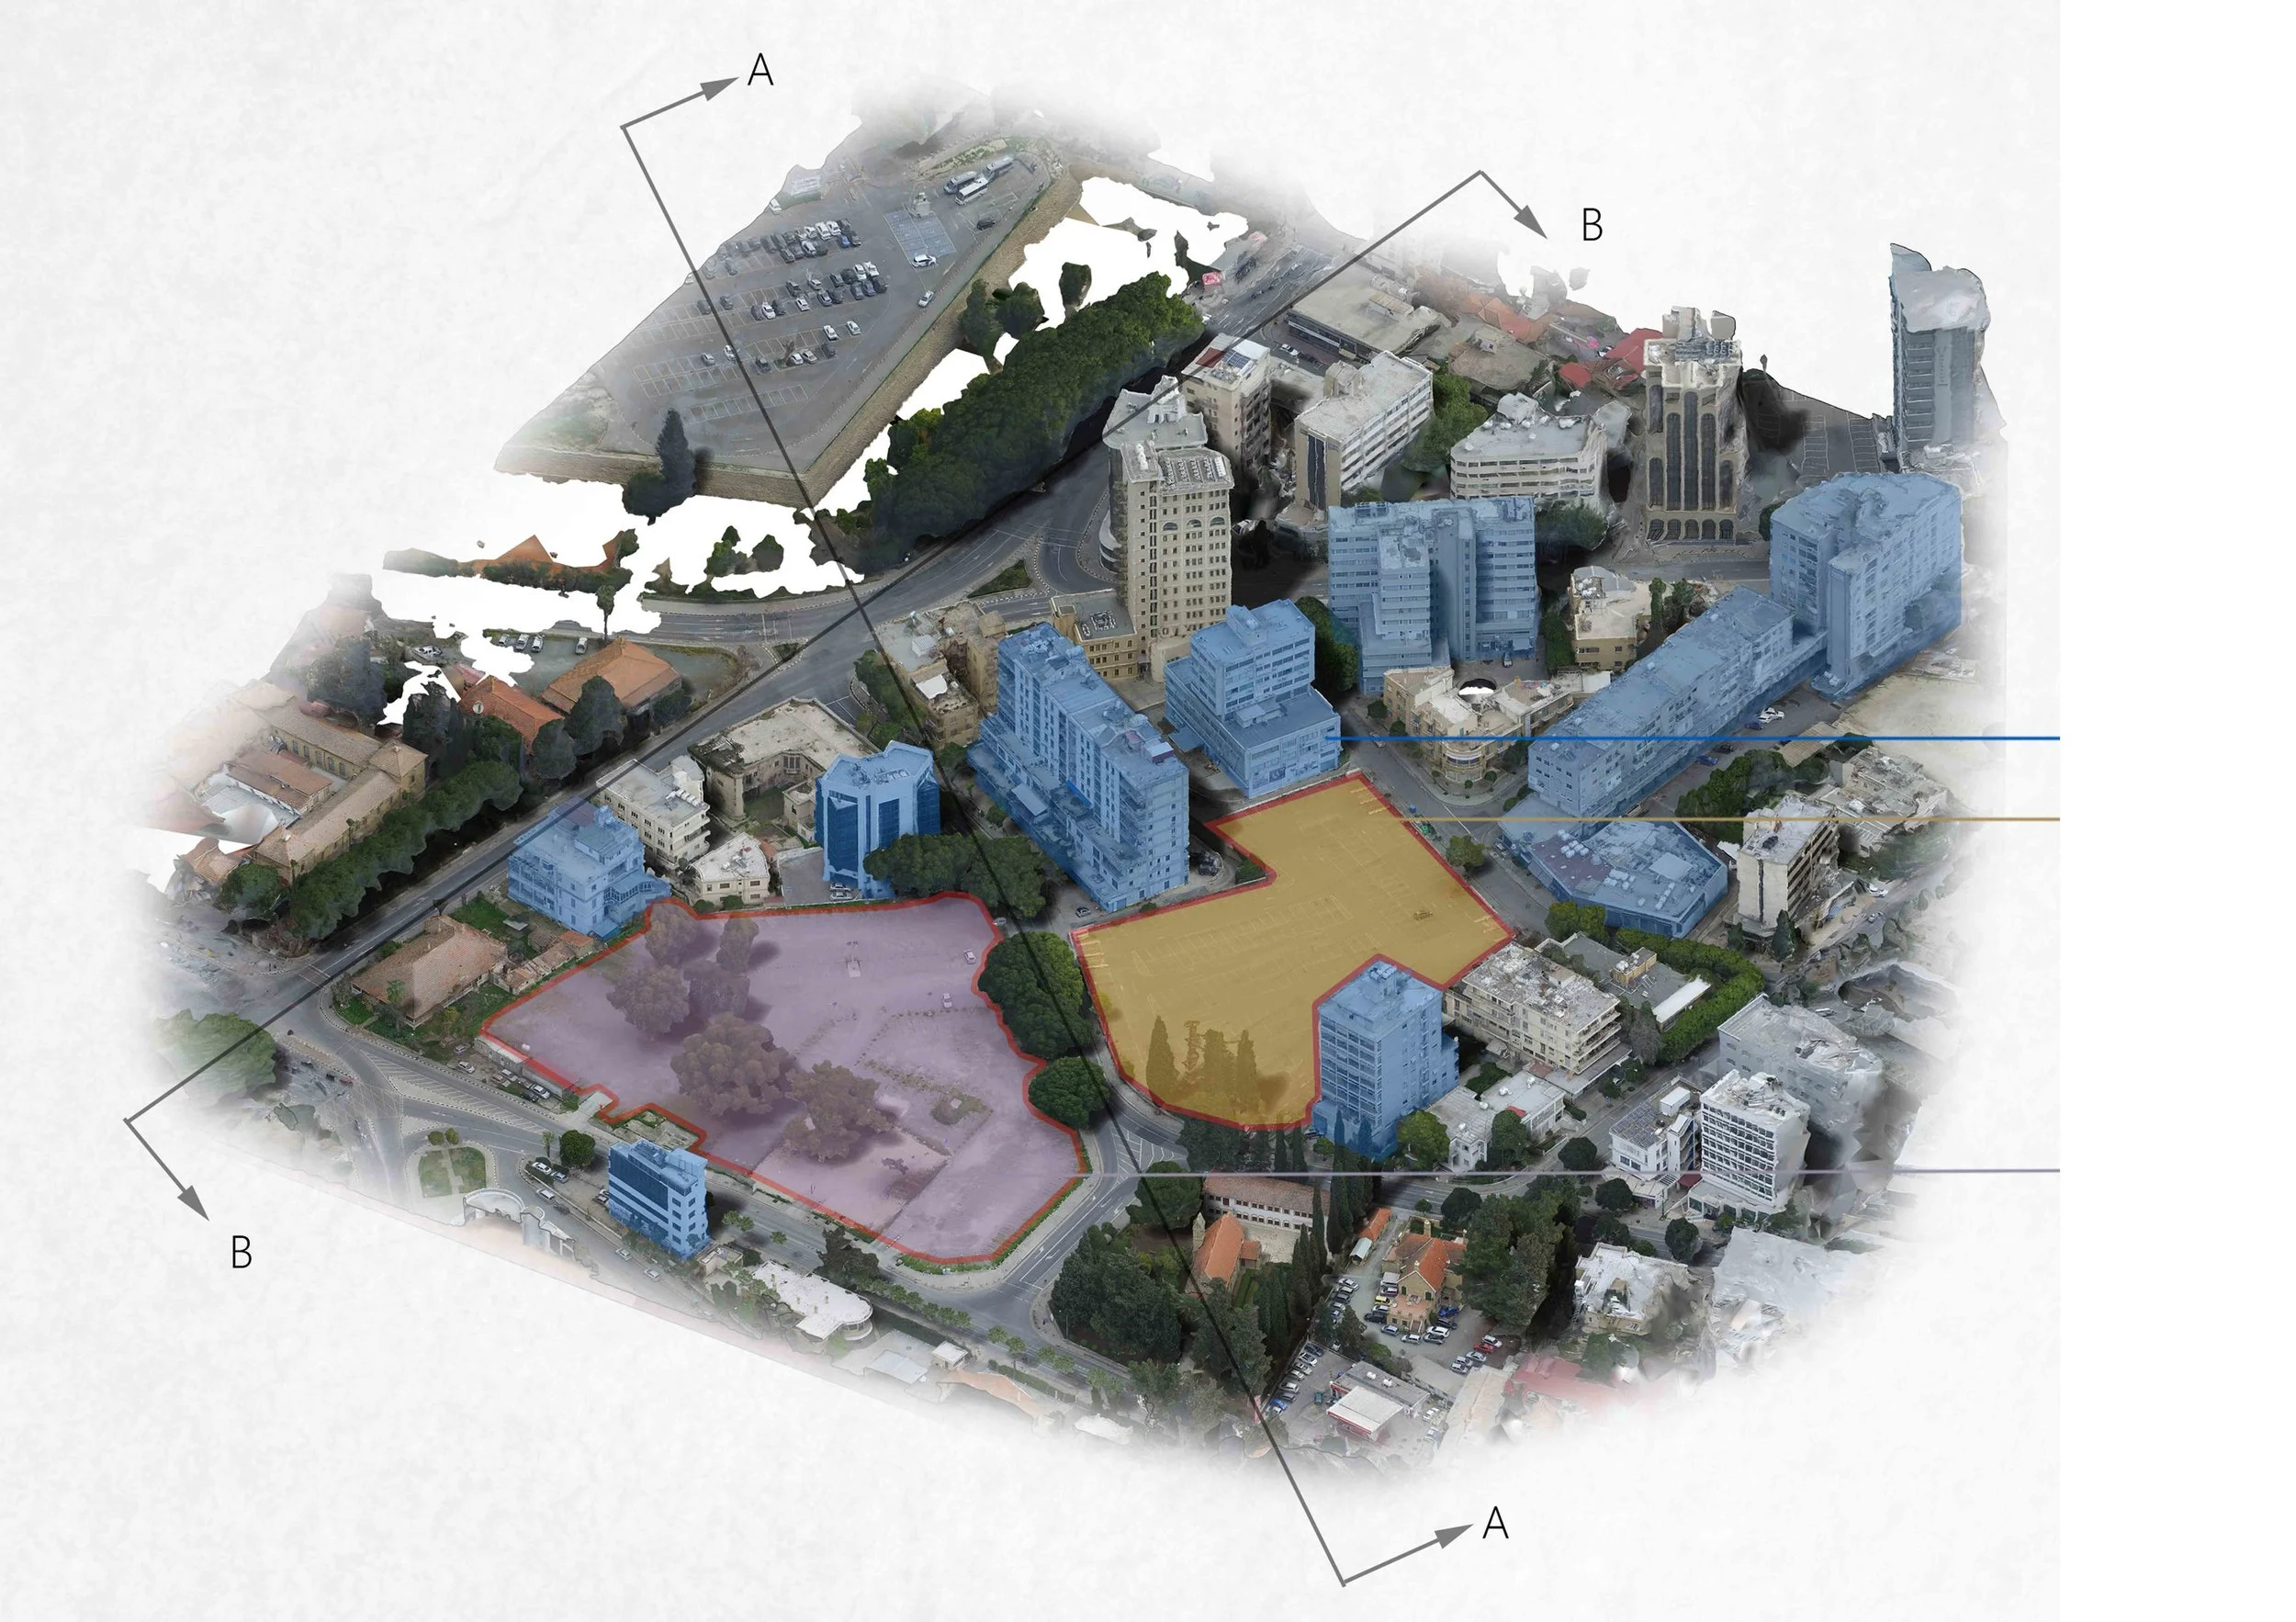
General Isometric View of the area with determined section references
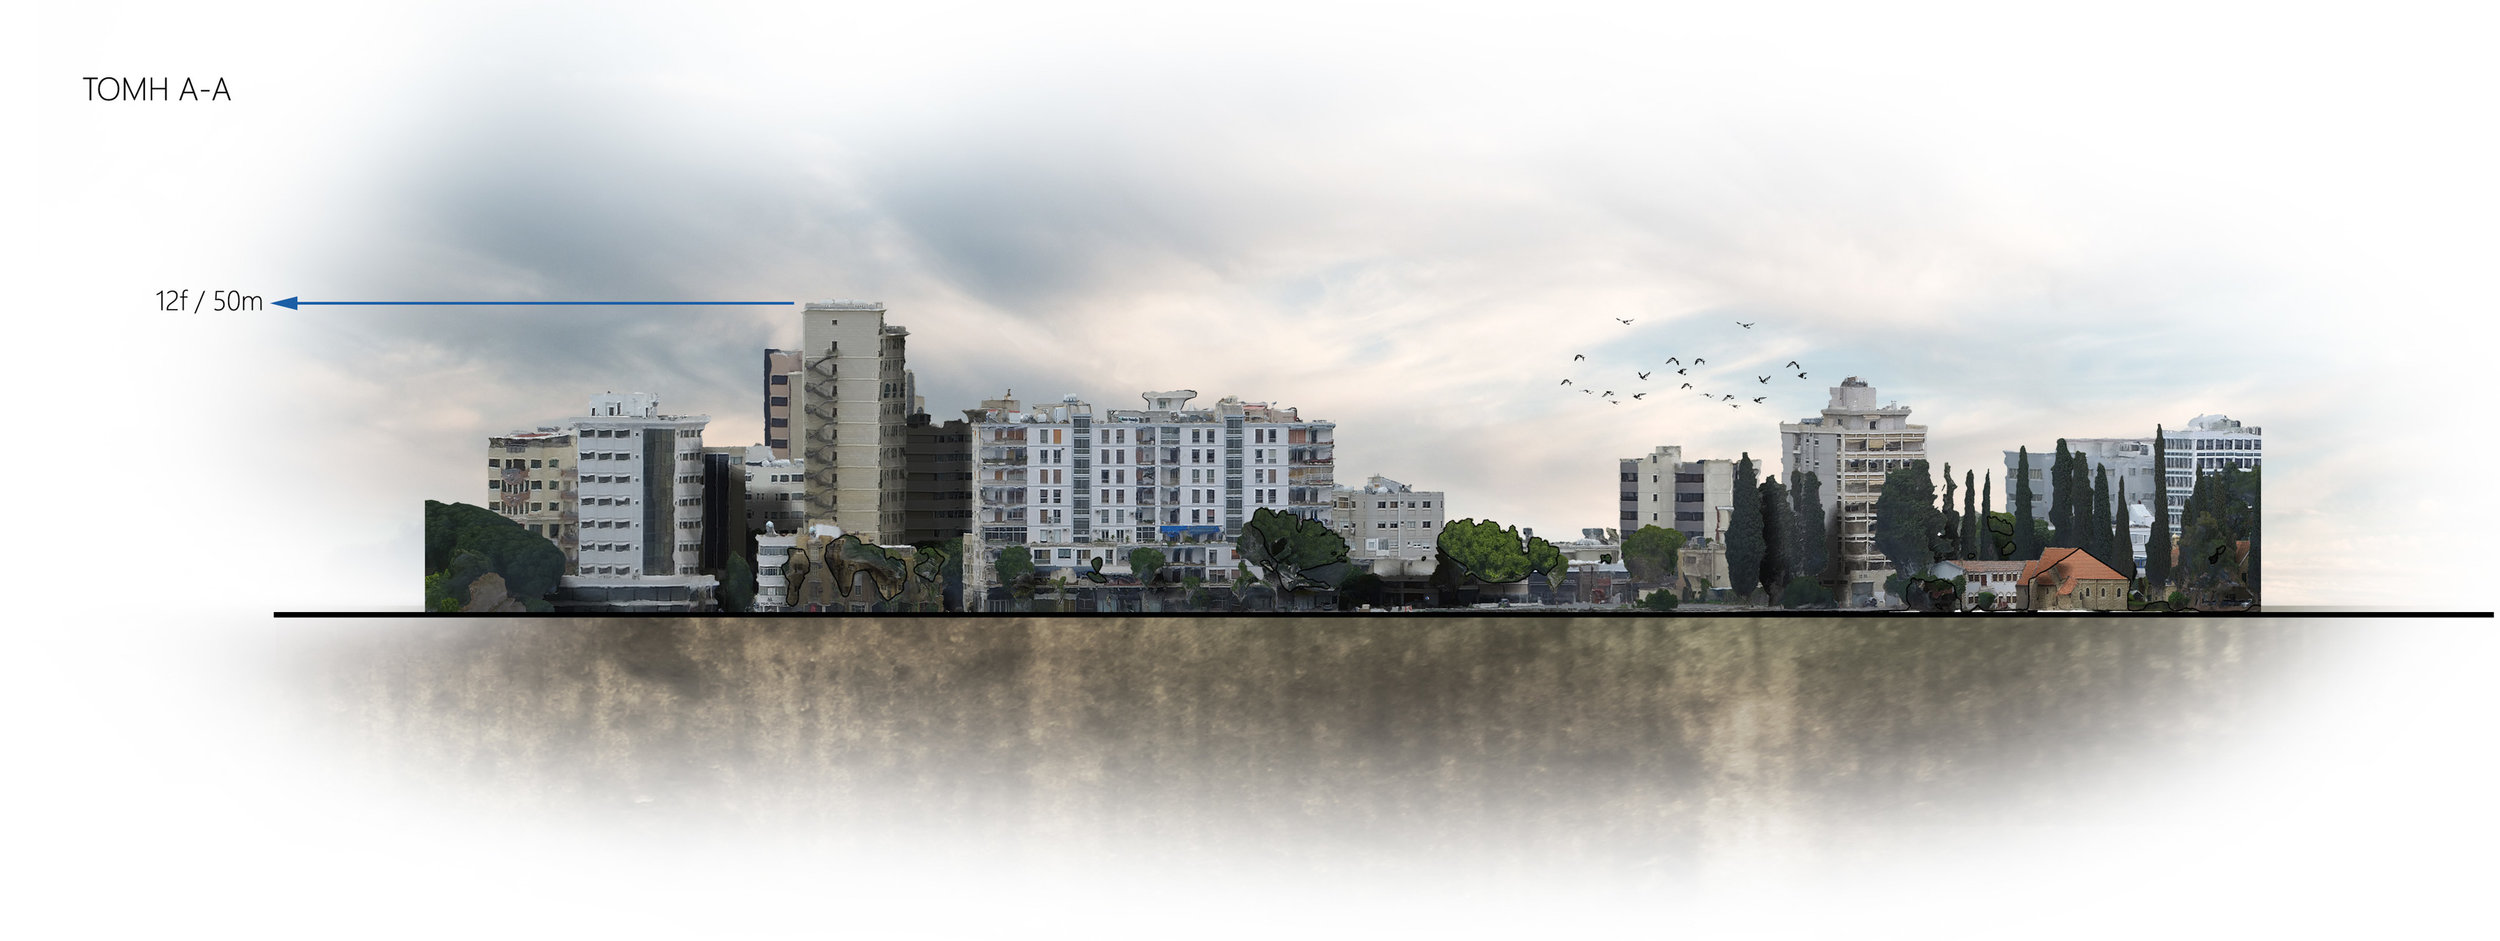
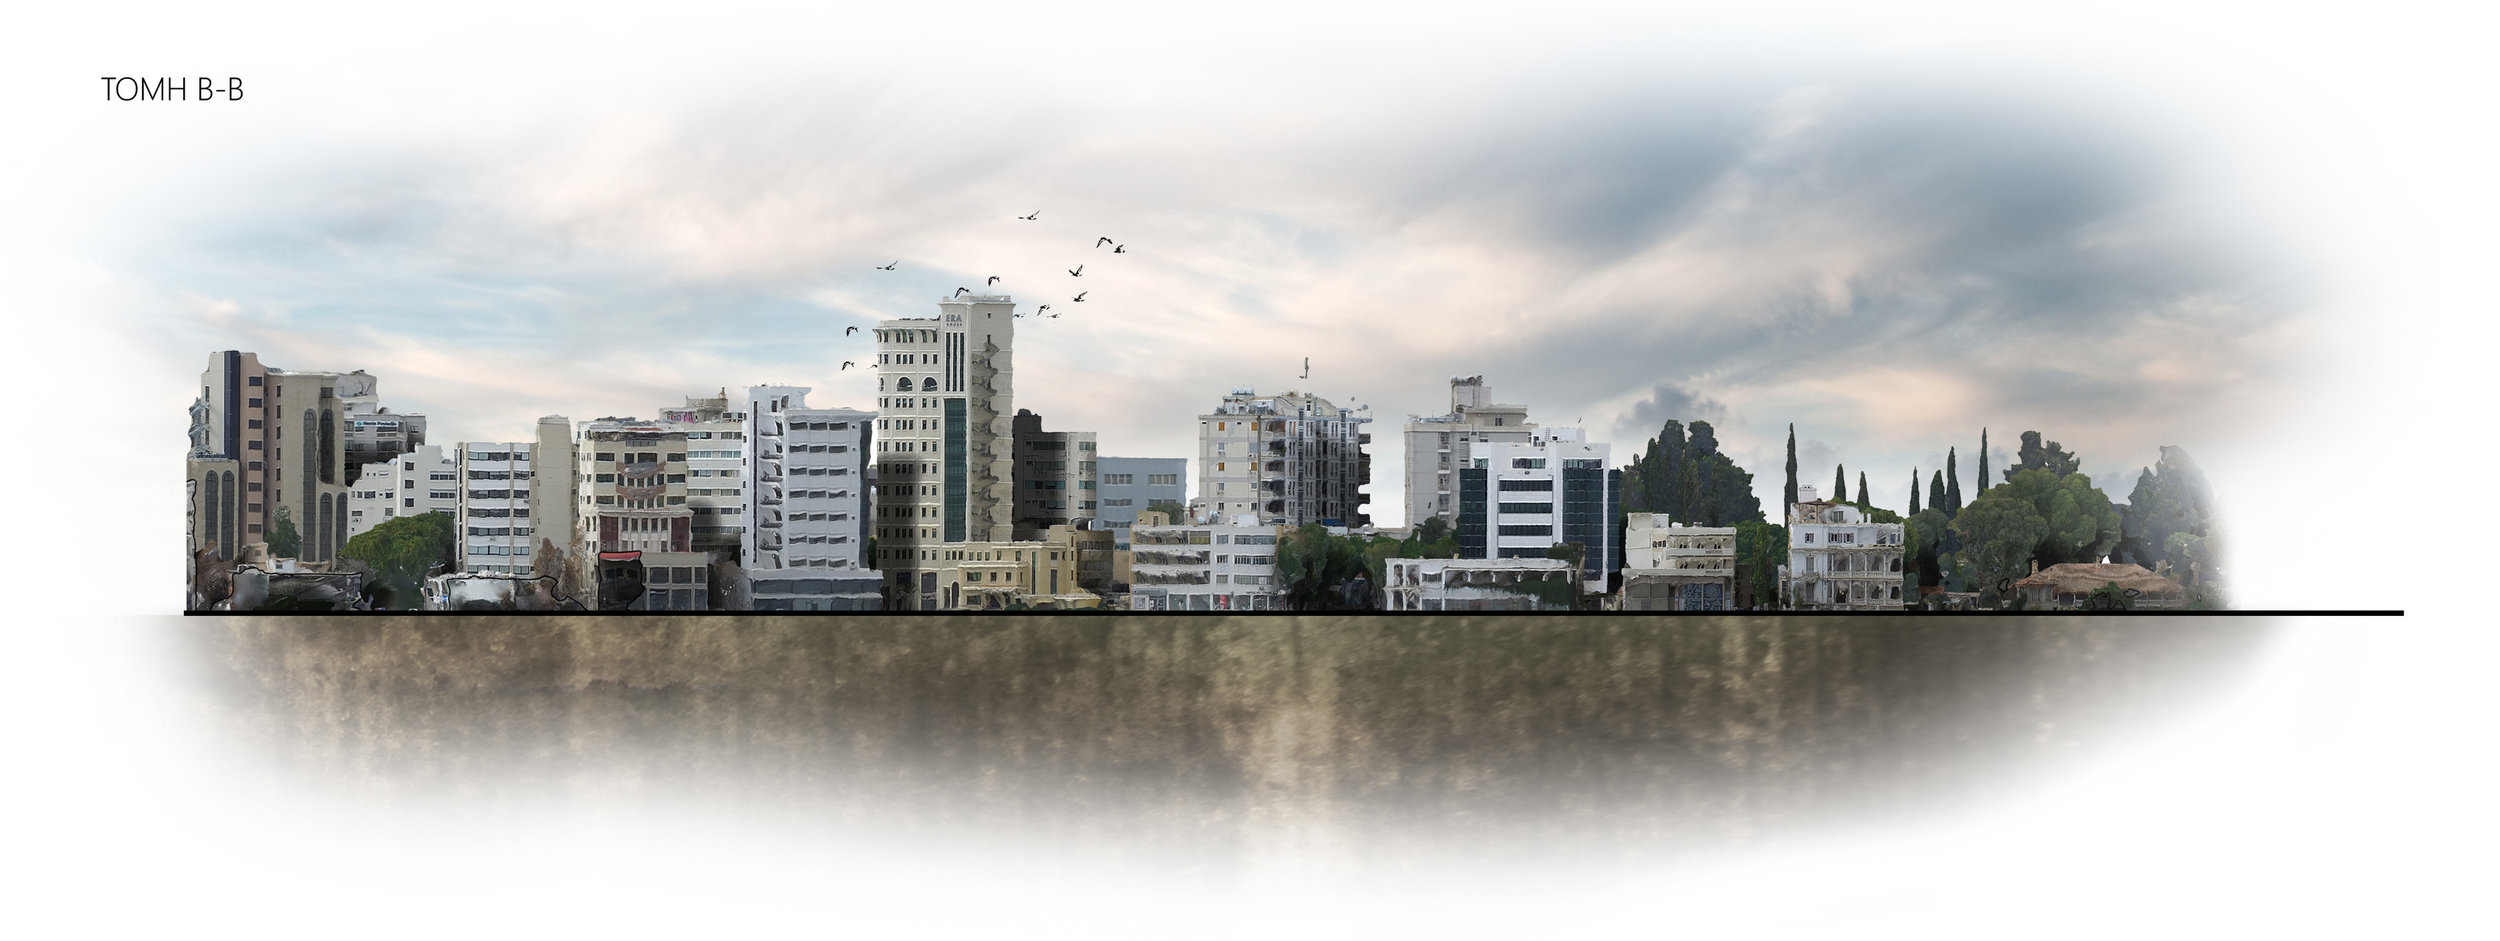
By observing the generated section diagrams, a second design decision was made relating to the maximum height of the proposed building. The tallest structure in the overall area appears to be 12 floors and approximately 50m in height. As such, though there is no height limitation for proposed buildings, to avoid creating a massive discrepancy in terms of the general skyline, it was decided to limit the proposed design to around 25 floors as a maximum. The proposed building would still stand out, but it wouldn’t be as oppressive as a 50 floor structure.
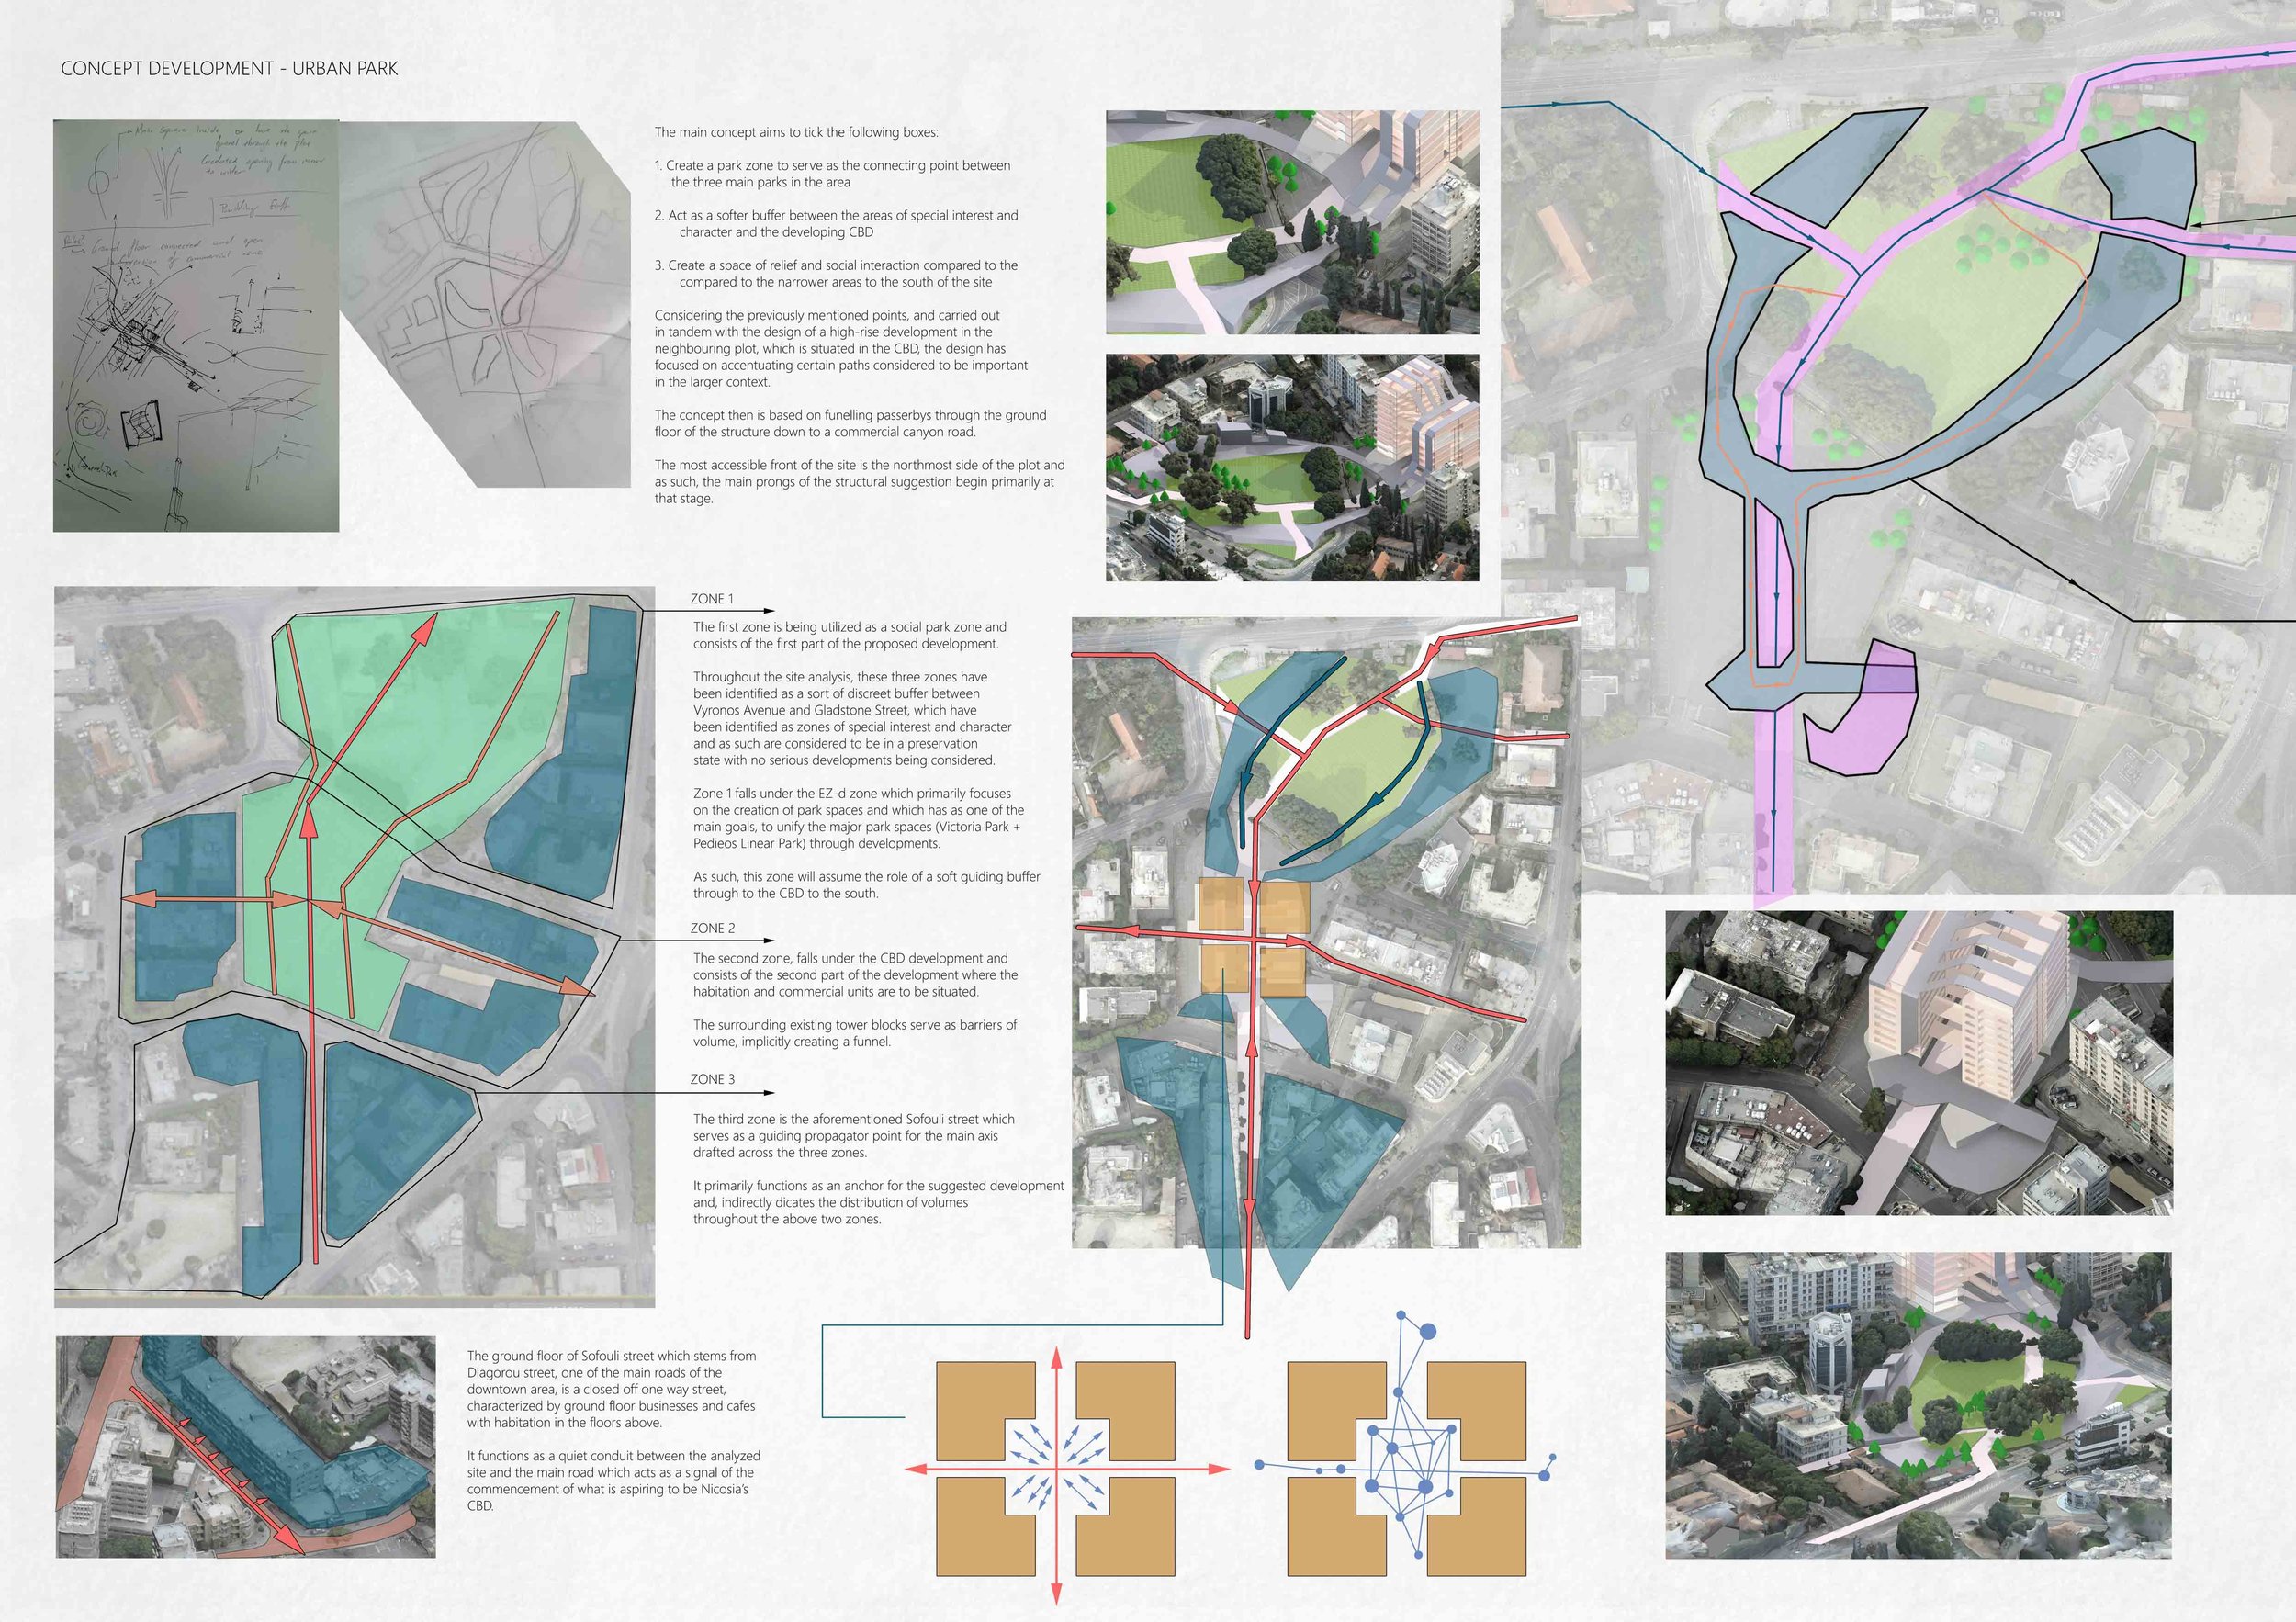
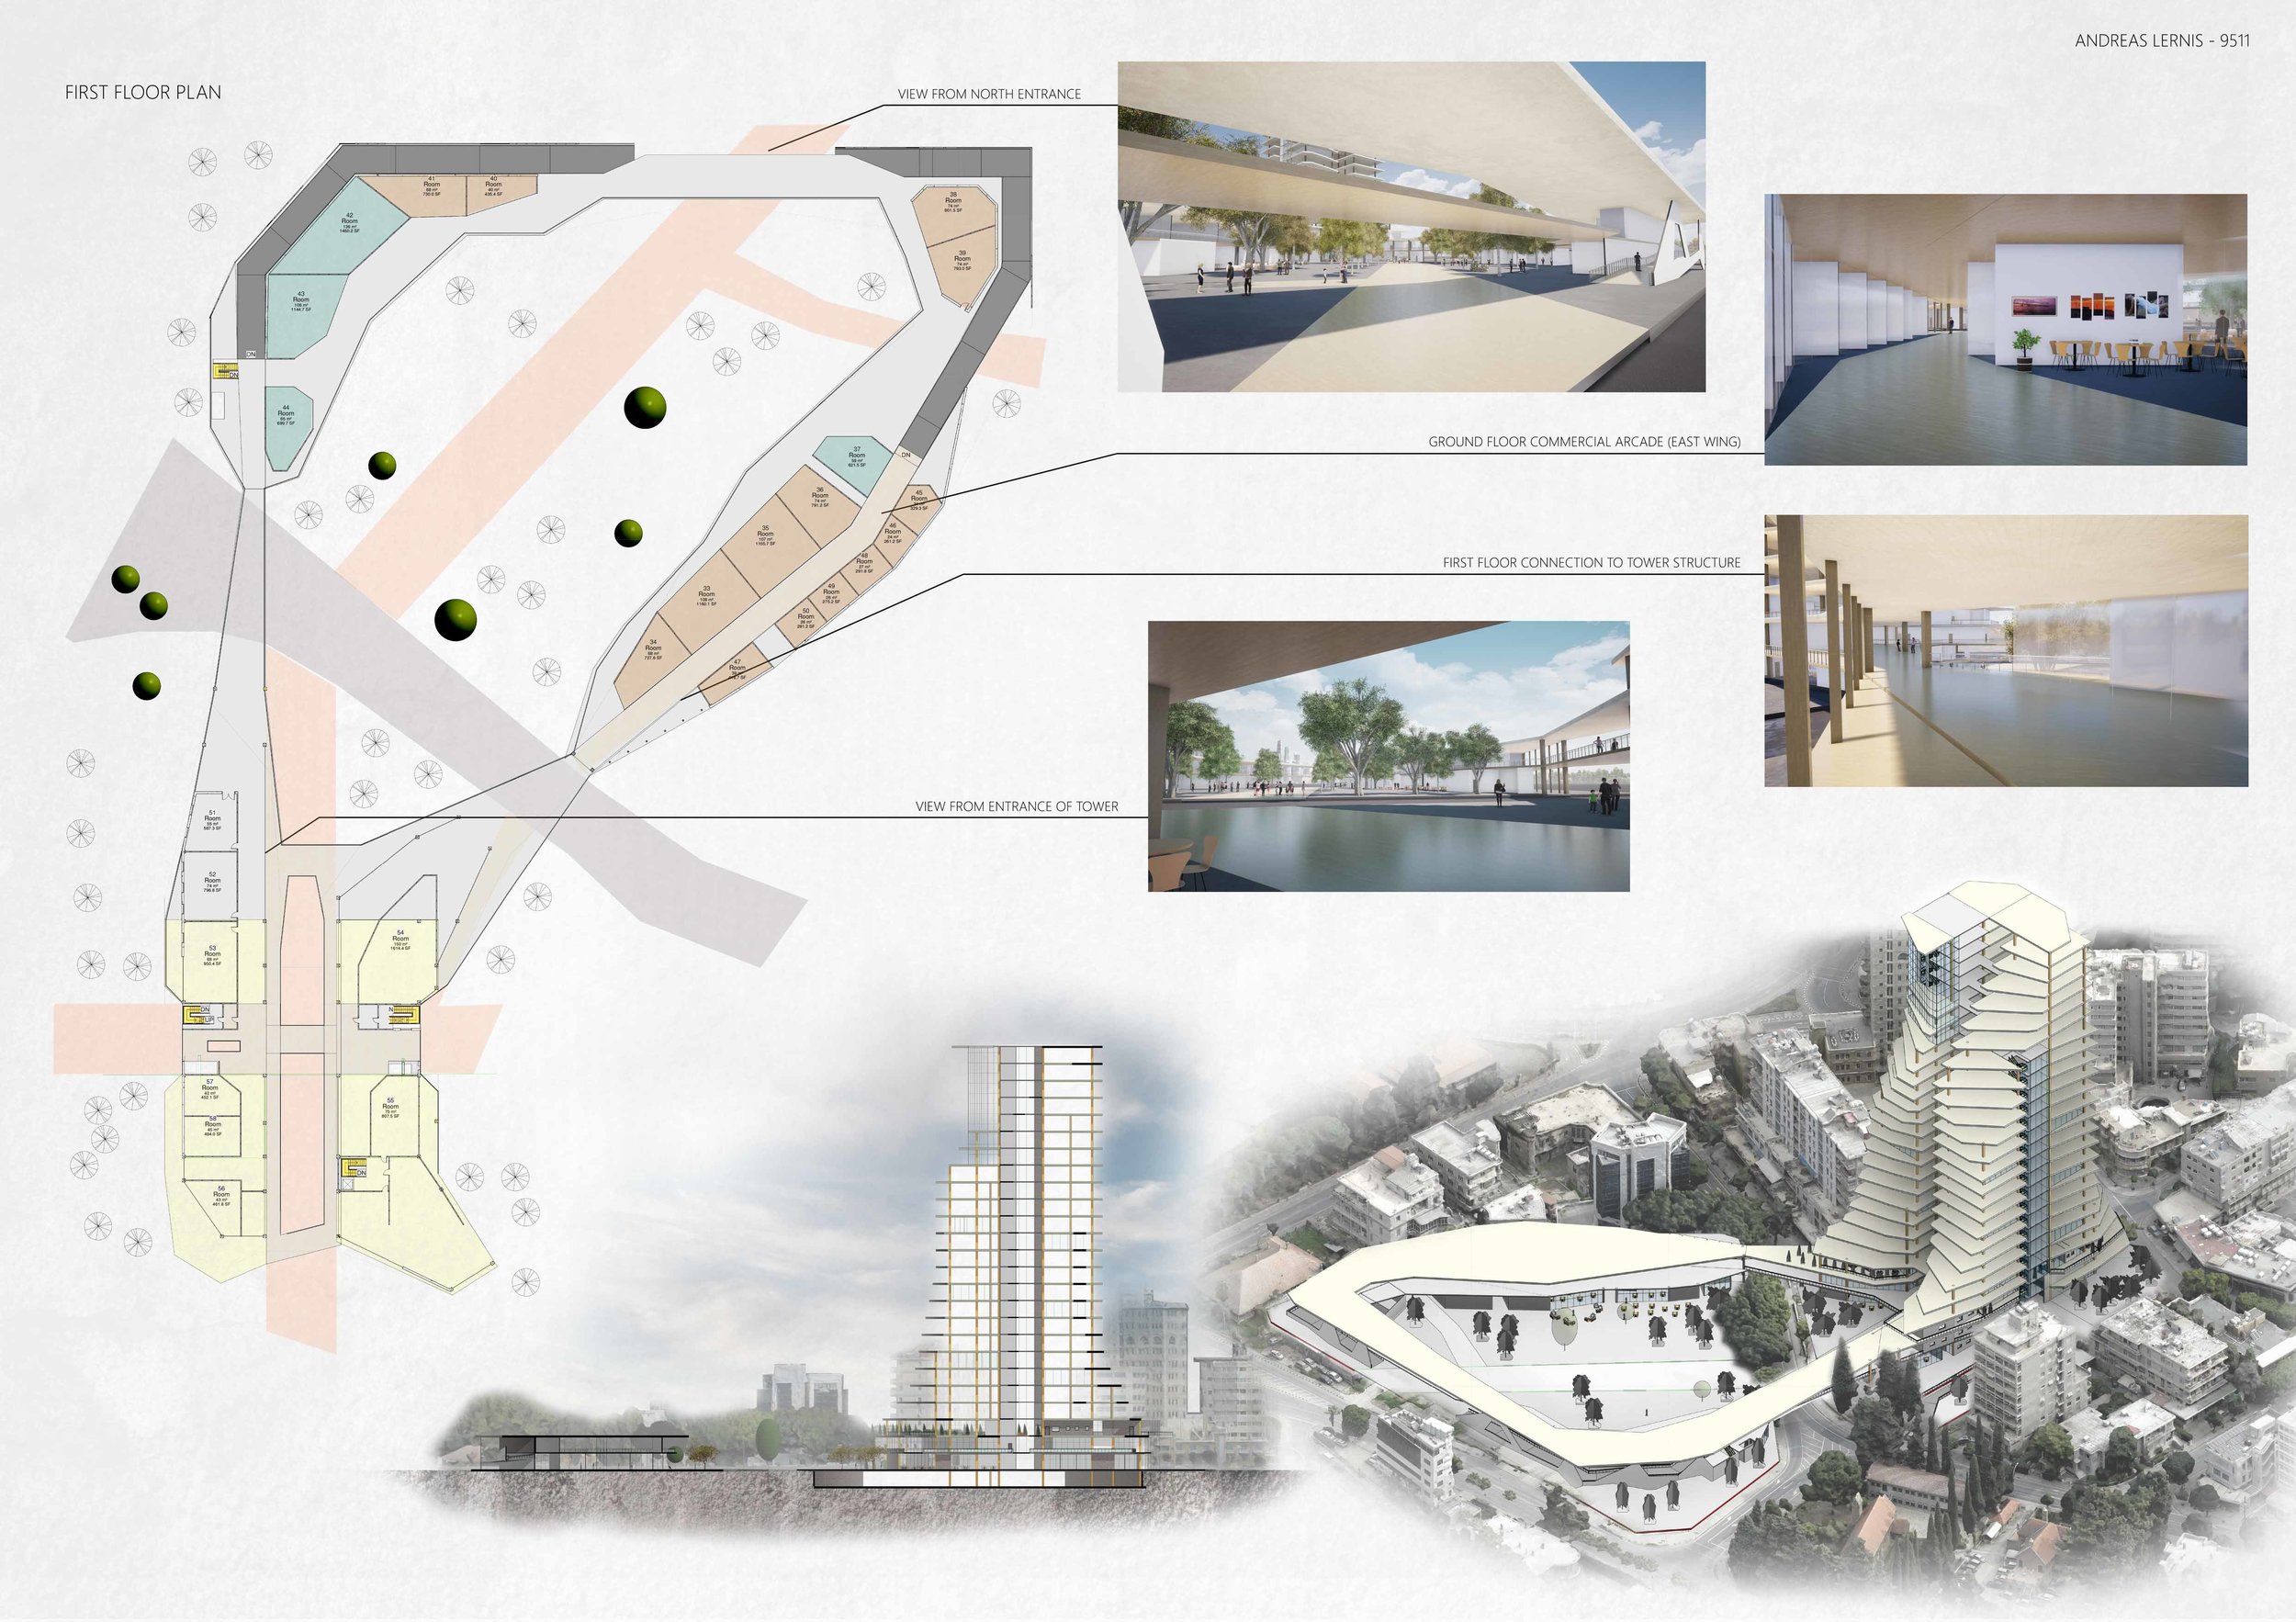
The generated mesh model was finally used for initially form and path finding before moving to Revit for the drafting of the final design.


By being able to design volumes within a photorealistic context, each introduced form could immediately be assessed in terms of its context and the effect it would have on the existing urban fabric. As such, each design decision was deliberate and based on an acceptance or rejection of the established forms and not due to an absence of data or due to the lack of granularity in provided data.
This led to the following final design which was drafted within Revit while using the point cloud data of the general area for reference.
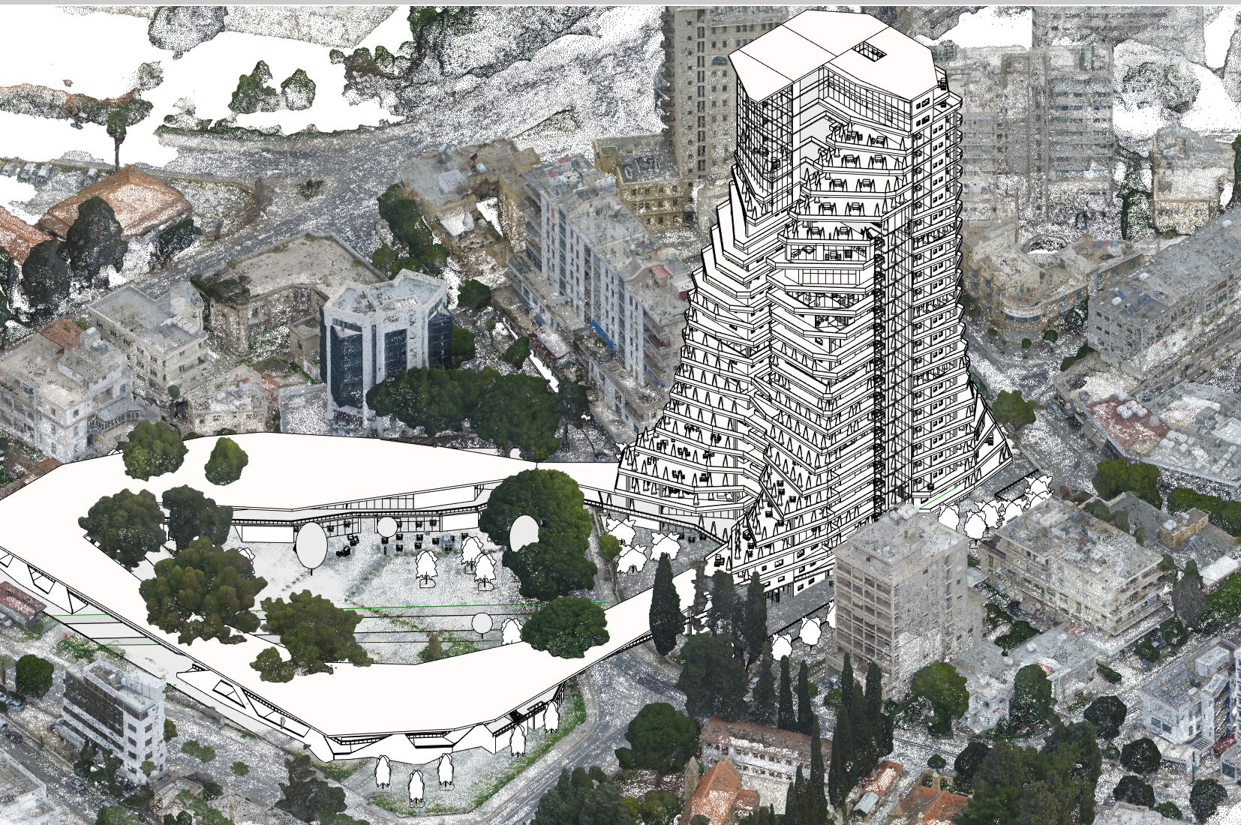
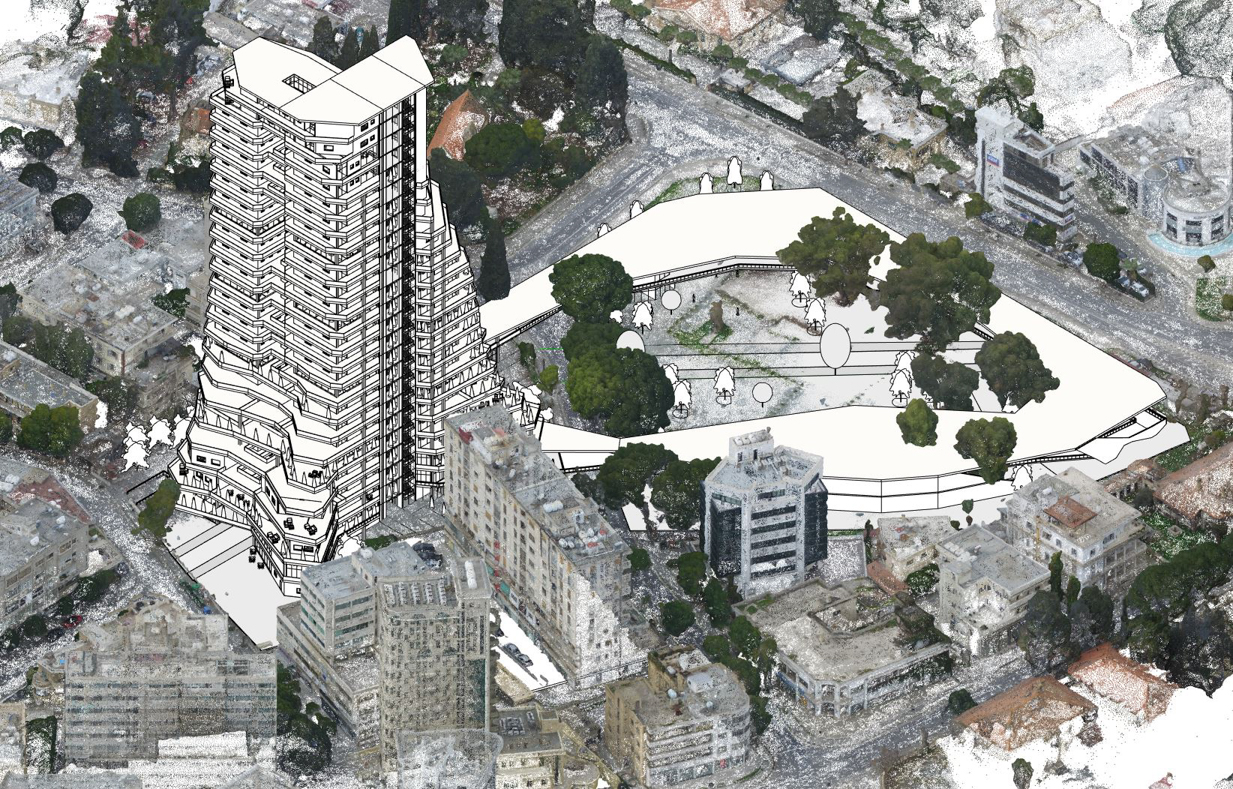
The above two visualizations show the work in progress and illustrate the workable interface presented through the design process. The slideshow below shows the final presentation panels and additional analyses carried out in the context for drafting a final design brief.
As this was a combined residential and urban design project, the slideshow below illustrates the analyses and final designs of the urban park component of the final idea.
Conclusion
As with the previous example, having a fully 3D, detailed model of the area offered a large range of conveniences and insights which would have taken a considerably longer time to gather with conventional surveying methods.
As illustrated from the diagrams and visualizations in the section above, the photogrammetric data was utilized in a number of different ways, from acting as the visual backbone for analytical observation to serving as a base for design experimentation and final drafting.
One of the most useful aspects was that it facilitated granular abstraction and simplification without this being the cause of time limitations or through the usage of insufficient or outdated planning drawings.